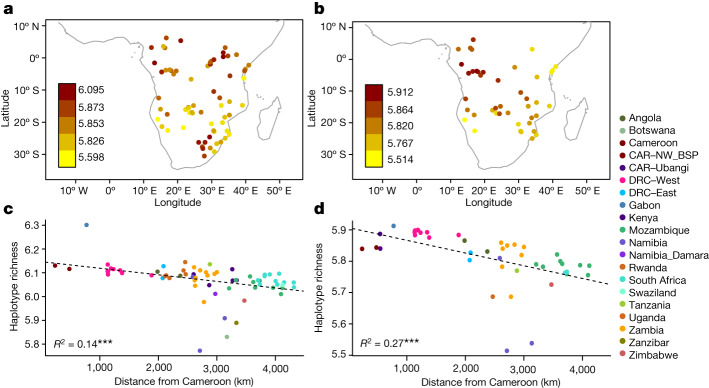
Fig. 4. Patterns of genetic diversity in BSP.
a, Map of haplotype richness estimated for the unmasked AfricanNeo dataset showing only BSP (n = 67 populations; with a minimum sample size of 10 individuals and a maximum size of 30 individuals). b, Haplotype richness estimated for the admixture-masked BSP dataset (n = 49 populations) that includes BSP with at least 70% of WCA-related ancestry. c,d, Decrease in haplotype richness estimates with geographical distance from Cameroon to the sampling location of each BSP included in the unmasked BSP dataset of a (c) and in the admixture-masked BSP dataset of b (d). Dashed lines represent the linear regression between haplotype richness estimates and geographical distances.

