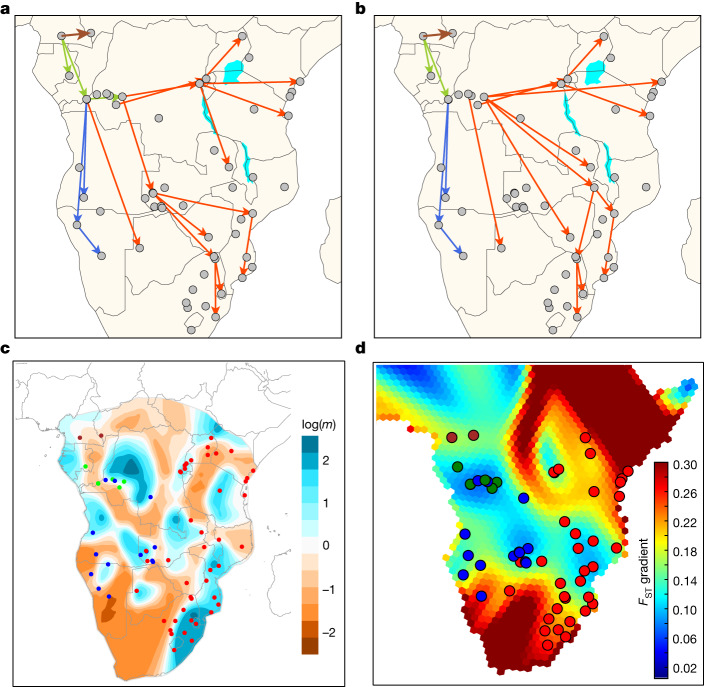
Fig. 5. Migration routes and rates in BSP.
a,b, Putative migration routes of BSP inferred using pairwise FST values (a) and after removing the Zambian Lozi population from the analyses (b). Arrow colours correspond to north-western Bantu speakers 2 (NW-BSP 2; brown; one arrow between Cameroon and CAR), west-western Bantu speakers (WW-BSP; green), south-western Bantu speakers (SW-BSP; dark blue) and eastern Bantu speakers (E-BSP; red). c, Spatial visualization of effective migration rates (EEMS software) estimated with the masked Only-BSP dataset. log(m) denotes the effective migration rate on a log10 scale, relative to the overall migration rate across the habitat. Populations are coloured according to each Bantu-speaking linguistic group (brown, green, dark blue and red dots). d, GenGrad analysis using FST as the genetic distance for the admixture-masked BSP dataset. Hexagons of the grid were plotted with a colour scale representing the FST gradient (key).

