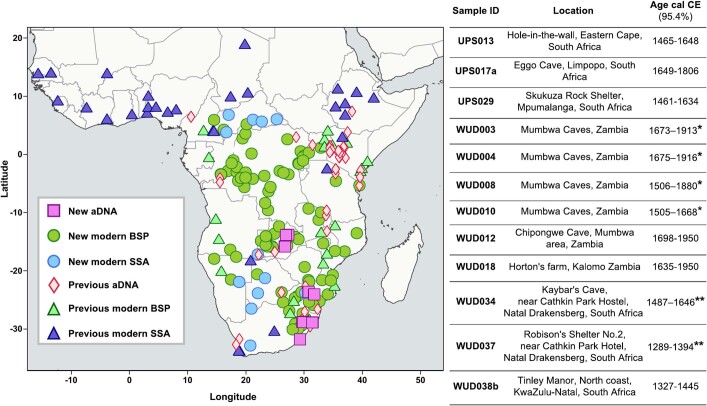
Extended Data Fig. 1. Geographical locations of modern and ancient populations.
Geographic information on modern populations and ancient individuals that were included in this study. Figure showing the locations of 12 new aDNA individuals (pink squares) sequenced in this study and new populations genotyped in this study: 147 Bantu-speaking populations (BSP; n = 1,526 individuals; green circles) and 16 sub-Saharan African (SSA) populations that are non-BSP (n = 237; blue circles), together with comparative data from 83 previously published aDNA individuals (red diamonds), 21 BSP (n = 967; green triangles) and 30 SSA that are non-BSP (n = 1,548; dark blue triangles). Archaeological and biological information about ancient DNA individuals from Zambia and South Africa (SA) presented in this study for the first time is included in the additional table and in Supplementary Table 14. Radiocarbon dates are reported for the first time in this study, except for * from Steyn et al.8 and ** from Meyer et al.48 Vector basemap and map tiles were provided by CartoDB (© CARTO 2023).

