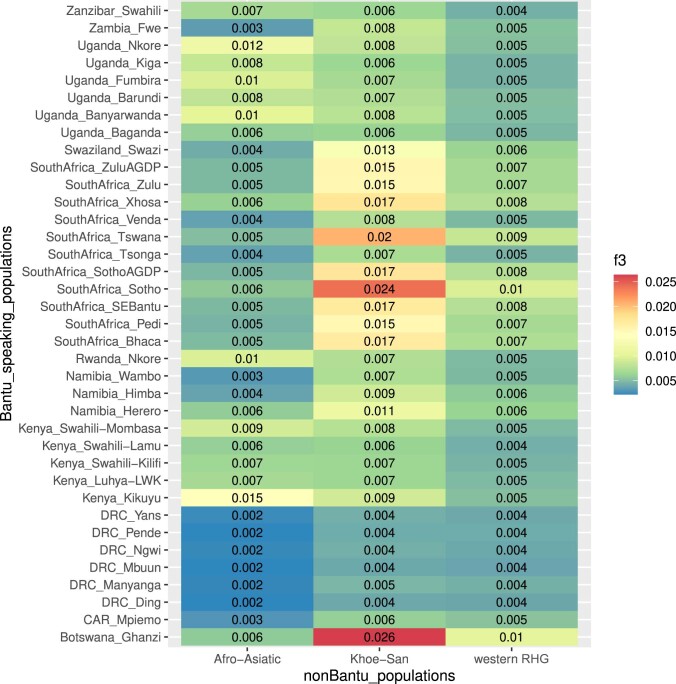
Extended Data Table 1.
Genetic affinity of BSP to non-BSP estimated using f3-statistics
Genetic admixture was tested using f3-statistics in the form f3(Yoruba; non-BSP, target BSP). The comparative non-BSP are represented by an Afro-Asiatic-speaking population from Ethiopia (Amhara), a Khoe-San population (Ju/’hoansi) and the western RHG Baka population. The figure shows the mean values for each population. The standard errors (SE) of each mean are reported in Supplementary Figs. 28–30.

