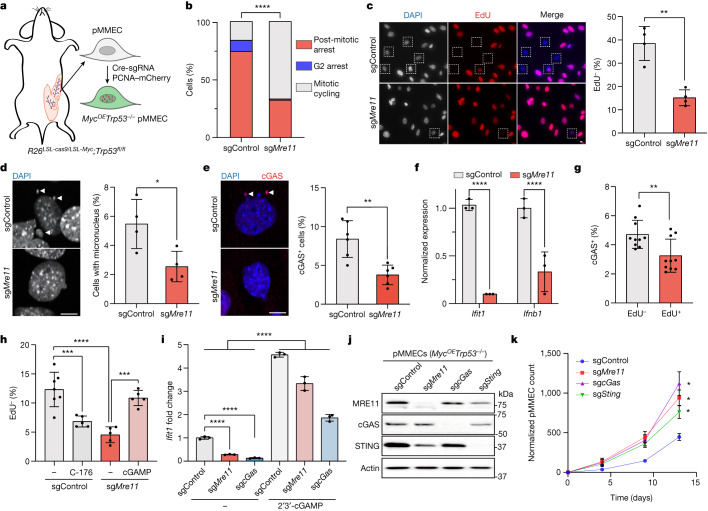
Fig. 2. MRE11 promotes post-mitotic arrest through cGAS–STING activation.
a, Schematic of the generation of PCNA–mCherry-labelled MycOETrp53−/− pMMECs for time-lapse microscopy. b, Cell fate analyses of sgControl (n = 135 independent cells) versus sgMre11 (n = 117 independent cells) pMMECs by time-lapse microscopy. sgControl versus sgMre11, P < 0.0001, two-tailed chi-squared test. c, Left, representative images of 24-h EdU pulse quiescence assays, with dashed squares indicating EdU-negative (that is, quiescent) nuclei. Right, percentage of EdU-negative cells in sgControl and sgMre11 pMMECs. Each data point represents n = 300 independent cells, P = 0.0012. Representative of three independent biological experiments. d,e, Images (left) and percentage (right) of cells with micronuclei (d) or cGAS foci (e), annotated with arrowheads. n = 440 independent sgControl and sgMre11 cells, P = 0.0256 (d) or n = 1,800 independent sgControl and sgMre11 cells, P = 0.0018 (e). Representative of three independent biological experiments. f, Relative mRNA levels of ISGs Ifit1 and Ifnb1, normalized to Actb, measured by quantitative PCR with reverse transcription. Graph shows three biological replicates, P < 0.0001. Representative of three independent biological experiments. g, Percentage of EdU– and EdU+ sgControl pMMECs with cGAS foci. n = 338 (EdU–) and n = 1,971 (EdU+) independent cells, P = 0.0061. Representative of three independent biological experiments. h, Percentage of quiescent (EdU–) sgControl pMMECs (n = 797 independent cells) with or without 24 h of C-176 (STING antagonist, n = 633 independent cells) treatment, and sgMre11 pMMECs (n = 646 independent cells) with or without 24 h of 2′3′-cGAMP (n = 580 independent cells) treatment. sgControl versus sgControl + C-176, P = 0.0009; sgControl versus sgMre11, P < 0.0001; sgMre11 versus sgMre11 + cGAMP, P = 0.0004. Representative of three independent biological experiments. i, Ifit1 expression is induced by treatment of sgControl, sgMre11 and sgcGas MycOETrp53−/− pMMECs with 2′3′-cGAMP. Data show mean ± s.e.m. for n = 3 biological replicates; ****P < 0.0001. Representative of three independent biological experiments. Grouped analyses performed with a two-tailed t-test (c–i). *P < 0.05, **P < 0.01, ***P < 0.001, ****P < 0.0001. j, Western blot confirmation of MRE11, cGAS and STING CRISPR targeting in MycOETrp53−/− pMMECs. k, Normalized pMMEC counts over time. Data show mean ± s.e.m. for n = 4 independent biological replicates for each genotype and time point. Representative of three independent biological experiments. Grouped analyses performed with a two-tailed t-test. *P < 0.0001. Scale bars, 10 µm (c,d,e).

