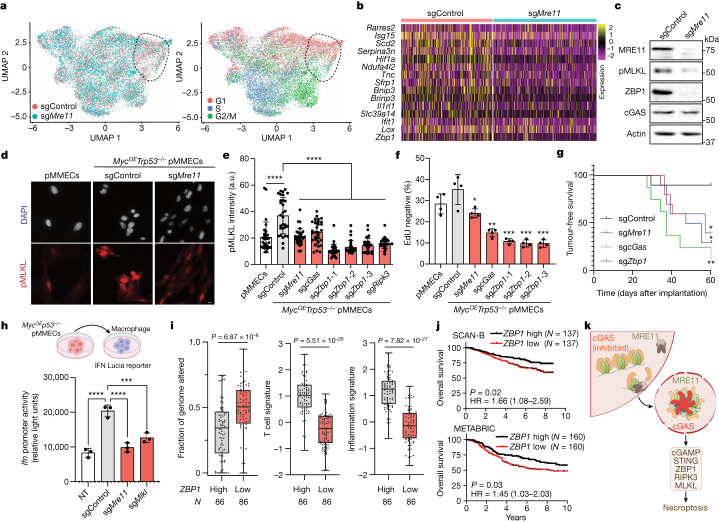
Fig. 4. MRE11–cGAS–STING stimulates ZBP1–RIPK3–MLKL-dependent necroptosis.
a, scRNA-seq UMAP analyses of sgControl versus sgMre11 MycOETrp53−/− pMMECs. The UMAP on the right is pseudocoloured according to the predicted cell cycle state. A ROI with an increased abundance of sgControl compared with sgMre11 pMMECs is outlined. b, Heatmap showing gene expression in sgControl G1 compared with sgMre11 G1 single cells. c, Western blot of ZBP1 and pMLKL in sgControl and sgMre11 pMMECs, representative across three independent experiments. d, Immunocytochemistry analysis of pMLKL in pMMECs: untransduced, sgControl and sgMre11. e, Quantification of pMLKL fluorescence intensity across genotypes in arbitrary units (a.u.). Data are mean ± s.e.m., n = 30 cells for each cell line, representative of 3 independent biological experiments. Statistical comparisons to sgControl by two-tailed t-test: ****P < 0.0001. Scale bar, 10 µm. f, Twenty-four hour EdU– percentage (mean ± s.e.m.) in the indicated pMMEC genotypes. Number of independent cells analysed per condition: 401 (pMMECs), 400 (sgControl, sgMre11 and sgcGas, sgZbp1-1 and sgZbp1-2), 390 (sgZbp1-3) and 398 (sgRipk3). Representative of three independent biological experiments. Statistical comparisons by two-tailed t-test to the sgControl genotype: sgMre11, P = 0.0224; sgcGas, P = 0.0014; sgZbp1-1, P = 0.0005; sgZbp1-2, P = 0.0004; and sgZbp1-3, P = 0.0004. g, Tumour-free survival after orthotopic transplantation of pMMECs expressing the indicated sgRNAs into the fourth mammary fat pad of female NOD/RAG1 mice, n = 10 independent animals per group. Two-tailed log-rank (Mantel–Cox) tests compared with sgControl are shown. *P = 0.0336 (sgMre11); **P = 0.0014 (sgcGas); *P = 0.0126 (sgZbp1). h, Schematic (top) and quantification (bottom) of IFN Lucia reporter activity in RAW 264.7 macrophages after treatment with supernatant from control pMMECs (NT) or pMMECs expressing the indicated sgRNAs. Graph depicts mean ± s.e.m., n = 3 (NT, sgControl, sgMre11, sgMlkl) samples from 3 independent biological experiments. Comparisons by two-tailed t-tests, NT versus sgControl, P < 0.0001; sgControl versus sgMre11, P < 0.0001; sgControl versus sgMlkl, P = 0.0007. i, Fraction of genome altered (left), T cell signature (middle) and inflammation signature (right) levels in TCGA TNBC cohort stratified by median-thresholded expression of ZBP1. Box plots display medians, interquartile range, and minimum and maximum values. Statistical comparisons by two-tailed t-tests. j, Kaplan–Meier overall survival analysis of TNBC with ZBP1 high versus low expression in the SCAN-B and METABRIC cohorts, using a two-tailed log-rank test. HR, hazard ratio. k, MRE11-mediated activation of cGAS and ZBP1-dependent necroptosis during tumorigenesis. Schematic in h was created using BioRender (www.biorender.com).

