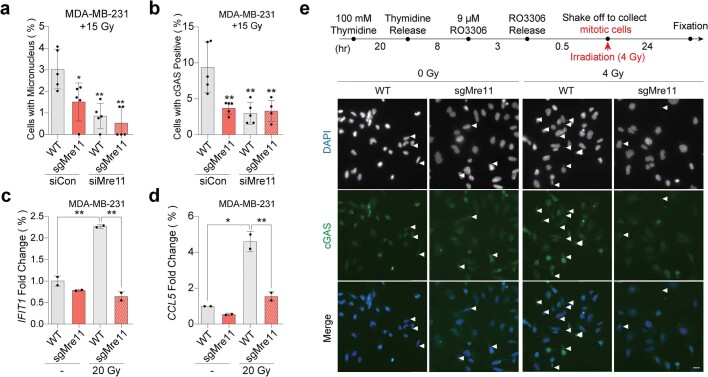
Extended Data Fig. 5. The translocation of cGAS to the micronuclei in mitotic MDA-MB-231 cells in response to ionizing radiation (IR) is dependent on Mre11.
a, b WT or sgMRE11 MDA-MB-231 cells transfected with control siRNA (siControl) or Mre11-targeting siRNA (siMRE11) and analyzed 24 h after 15 Gy IR. Cells with micronuclei (a) or cGAS foci (b) were counted by ICC analysis. n = 2 independent experiments; 615 (WT + siControl), 387 (sgMre11+ siControl), 467 (WT + siMre11), 620 (sgMre11 + siMre11) samples for each cell lines. (a) WT+siControl vs sgMre11+siControl; p = 0.029, WT+siMRE11; p = 0.0022, sgMRE11+siMRE11; p = 0.0014. (b) WT+siControl vs sgMRE11+siControl; p = 0.008, WT+siMRE11; p = 0.0058, sgMRE11+siMRE11; p = 0.0074. c, d, human ISG expression IFIT1 (c) and CCL5 (d) were observed in WT and sgMRE11 MDA-MB-231 cells 48 h after IR (20 Gy) by RT-qPCR. mRNA levels were normalized to β-actin mRNA levels. (c) WT vs WT + 20 Gy; p = 0.0121, WT + 20 Gy vs sgMRE11 + 20 Gy; p = 0.0099. (d) WT vs WT + 20 Gy; p = 0.0048, WT + 20 Gy vs sgMRE11+ 20 Gy; p = 0.0025. n = 2 independent experiments; 3 samples for each cell lines. e, Mitotic cells of the indicated MDA-MB-231 cells were irradiated and then fixed 24 h after irradiation. Scale bar, 20 μm. Image quantification is shown in Fig. 3e. Data are mean ± SEM. Unless otherwise specified, statistical analyses were determined by one-way ANOVA followed by Sidak’s multiple comparison post-test using a two-tailed test: *, p < 0.05; **, p < 0.01; ***, p < 0.001; ****, p < 0.0001.

