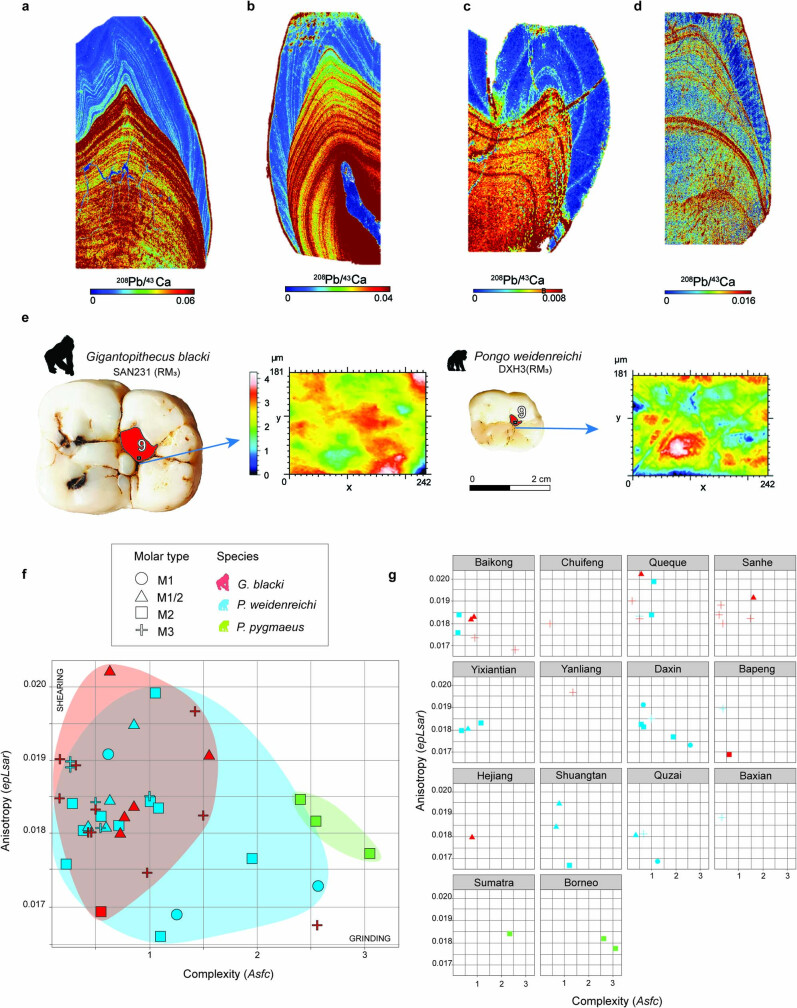
Extended Data Fig. 10. Behavioural proxies used in this study.
a, A 208Pb/43Ca elemental map of a left M3 G. blacki tooth (CSQ0811-5) from the early site of Queque showing distinct lead banding. b, The same scan of a male right P3 (CSQSN-31) also showing the distinct banding. c, Teeth from Shuangtan and d, Hejiang, showing the banding has lessened and become more blurred. e, Lower right M3 of G. blacki (left, SAN231) and P. weidenreichi (right, DXH3) teeth showing facet 9 (red shade), close the tip crushing point. 2D occlusal maps of the scanned areas are indicated by the blue arrows. f, Scatterplots with DMTA results for complexity (Asfc, x axis) versus anisotropy (epLsar, y axis). Symbols indicate the molar type and colour shades represent the three different species (G. blacki, P. weidenreichi and P. pygmaeus). All individual molars (n = 41) are plotted to visualize the dietary differences at species level. g, Individual molars are plotted per site (n = 14 of which 12 from China), following the geochronology from Early Pleistocene (top left) to Holocene (bottom right). Data visualization was performed in R Studio 1.4.1717.

