
Fig. 3. A summary of all datasets plotted against time.
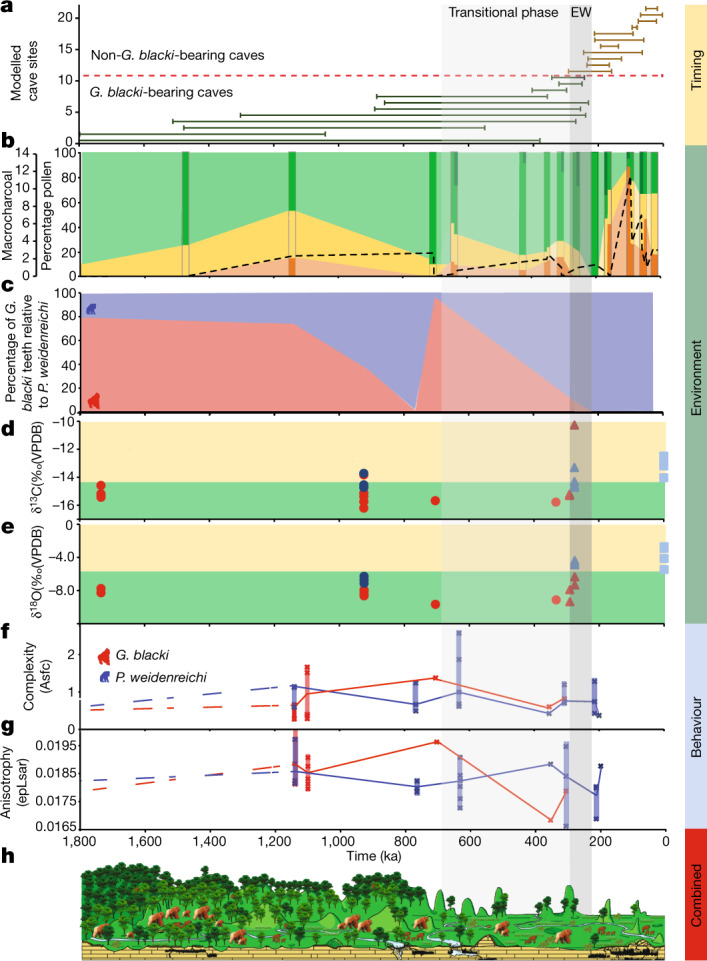
a, Timeline for extinction based on the modelled age ranges for all 22 caves. The numbers on the y axis relate to the caves in Fig. 2a. Note the reduced timeline (1,800 ka). The EW (255 ± 40 ka) is a vertical grey box (EW) with a solid lighter grey box (transitional phase) for the start of increased environmental variability. b, The percentage pollen plotted on a timeline grouped into arboreal (green), non-arboreal (yellow) and ferns (orange). The darker strips represent sites that contain pollen data, whereas the lighter sections in between represent an estimation of pollen changes. The microcharcoal (black dashed line) correlates with the increase in ferns and decline in arboreal cover. The dark green arboreal sections represent forest disturbance/high turnover taxa such as Trema, Celtis and Sapindaceae are present during the transitional phase and EW. c, The percentage of G. blacki teeth (red) relative to P. weidenreichi teeth (blue) at representative caves as a rough proxy for the relative abundance of G. blacki in comparison to P. weidenreichi in each site. The relative number of G. blacki teeth declines just before the transitional phase representing a change in faunal composition and during the transitional phase representing the extirpation of G. blacki. d,e, Isotopic changes for fossil P. weidenreichi (blue circles and triangles) and G blacki (red circles and triangles) teeth plotted on a timeline; modern P. weidenreichi are blue squares. δ13C (‰) (d) and δ18O(‰) (e). f,g, DMTA boxplot time-series for microwear complexity (f) and anisotropy (g) of G. blacki (red) and P. weidenreichi (blue); see Fig. 2c for definitions. h, A landscape and environment timeslice demonstrating the change in vegetation and primate species from the pre-EW, through the EW to the post-EW.