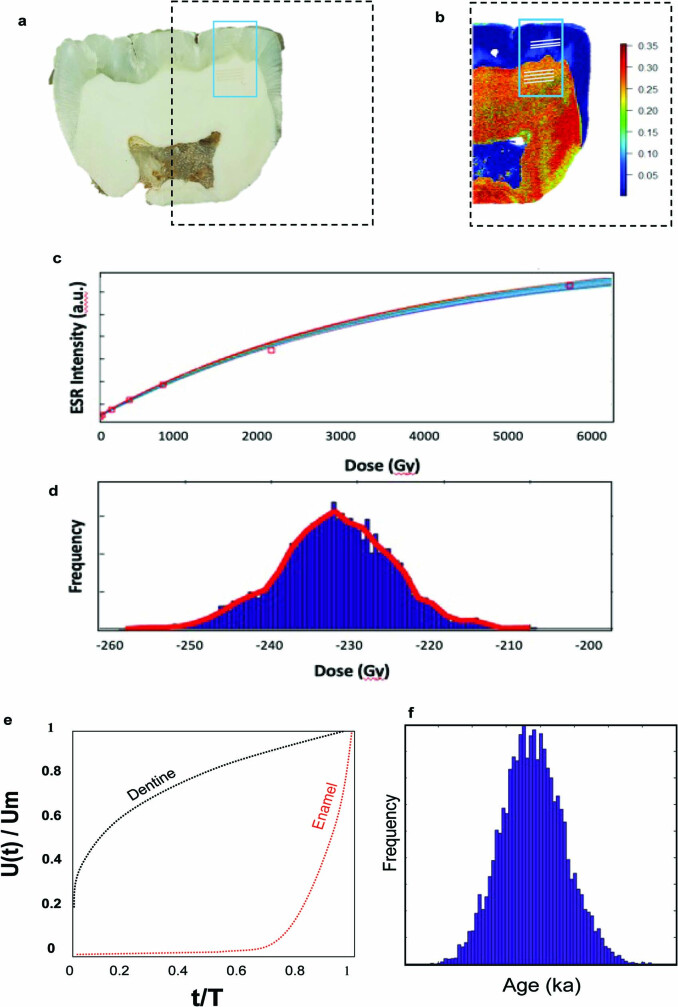
Extended Data Fig. 4. Coupled US-ESR dating protocol.
a, Section of Gigantopithecus blacki tooth (Baikong 1096), with dotted black rectangle describes the area analysed for uranium distribution, while the blue rectangle highlights the uranium series rasters position. Uranium rasters are placed parallel to each other with a 200 micron spacing to avoid contaminations. Surface prior to analyses are cleaned with a preablation run at high-speed (200microns/s) and lower energy (~10% of ablation energy). b, LA-ICP-MS elemental mapping of the uranium distribution and diffusion pattern into the dental tissues of Baikong 1096; the pattern observed is typical of a diagenetic diffusion signal with heterogenous distribution. c, Dose Response Curve (DRC) modelling using Monte Carlo algorithm (Baxian RTK201306-77). d, Dose equivalent distribution frequency of Baxian RTK201306-77 according to the DRC simulation, using the McDoseE 2.0 software from ref. 69. e, Model of uranium diffusion over time for both dentine and enamel of Zhanwang O1Z1 sample. f, Coupled US-ESR Age distribution frequency using70 programme of Zhanwang O1Z1 sample.

