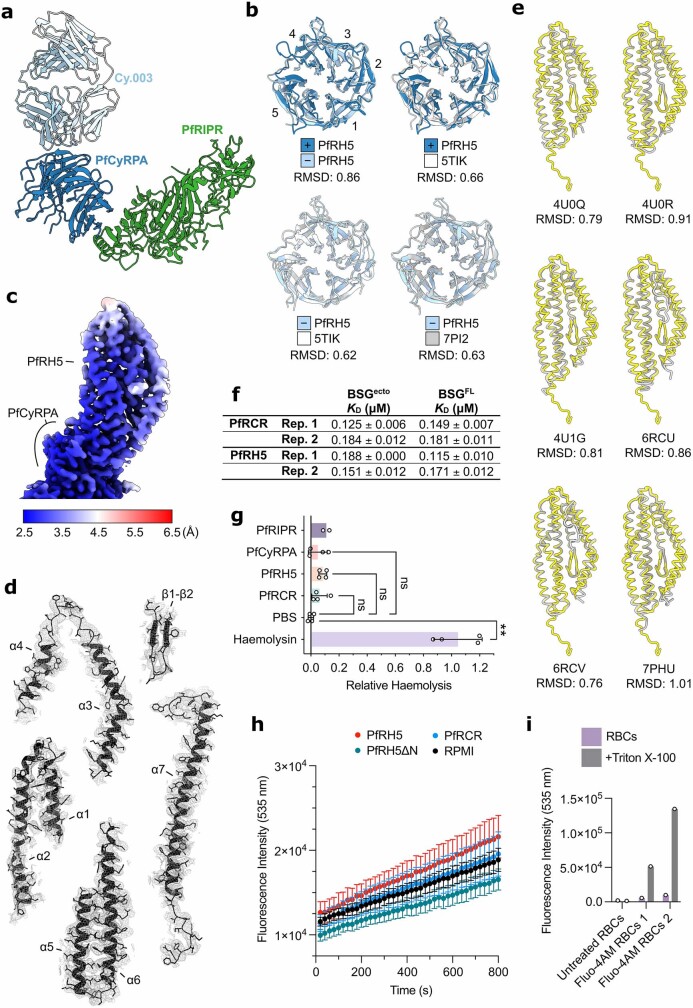
Extended Data Fig. 4. Comparison of PfRH5 and PfCyRPA structures and assessment of PfRH5 function.
a, Structure of the PfCyRPA-PfRIPR-Cy.003 complex in cartoon representation, with PfRIPR (green), PfCyRPA (blue) and Cy.003 Fab (light blue) highlighted. b, Structural alignments of PfCyRPA from PfRCR-Cy.003 (dark blue), PfCyRPA-PfRIPR-Cy.003 (light blue), Cy.003-bound PfCyRPA (grey, PDB ID: 7PI25), and unbound PfCyRPA (white, PDB ID: 5TIK19), with backbone RMSDs to each pair given below. Blades 1 through 5 are labelled. c, Cryo-EM map of PfRH5 following local refinement, post-processed by DeepEMhancer and coloured by local resolution. d, PfRH5 split into secondary structure elements, shown with their corresponding cryo-EM densities using the composite PfRCR-Cy.003 map post-processed with DeepEMhancer. e, Structural alignment of PfRH5 from PfRCR-Cy.003 (yellow) with crystal structures (grey) of basigin-bound (PDB ID: 4U0Q)3 or Fab-bound PfRH5 (PDB IDs: 4U0R, 4U1G, 6RCU, 6RCV, 7PHU)3,4. Backbone RMSDs between PfRCR-Cy.003 and each crystal structure are given below. f, Binding affinity measurements for PfRCR and PfRH5 binding to basigin ectodomain (BSGecto) and full-length basigin (BSGFL) determined by microscale thermophoresis. Values determined from two independently prepared samples are provided. Each of these was measured three times. g, Relative haemolysis following the incubation of red blood cells with 2 µM of either PfPIPR, PfCyRPA, PfRH5, PfRCR or alpha-haemolysin, or with PBS alone. Only haemolysis induced by alpha-haemolysin is significantly greater than observed with PBS alone (p = 0.0016 for PBS vs Haemolysin, whereas p = 0.3207 for PBS vs PfRH5, p = 0.8673 for PBS vs PfRCR, and p > 0.9999 for PBS vs PfCyRPA, determined using a Kruskal-Wallis one-way ANOVA adjusted for multiple comparisons using Dunn’s test. N = 2 for PfRIPR (and therefore no statistical analysis has been performed) and n = 4 for all others. Individual data points, the mean +/− SD are shown. h, Raw fluorescence intensity measured at 535 nm after incubation of Fluo-4 loaded red blood cells (RBCs) with PfRH5, PfRH5ΔN, PfRCR, or RPMI alone. The mean +/− SEM for a technical triplicate are shown. i, Raw fluorescence intensity measured at 535 nm of untreated and Fluo-4AM treated RBCs, alone or following addition of 0.1% v/v Triton X-100, demonstrating successful loading of Fluo-4 (N = 1 for untreated RBCs and n = 2 for Fluo-4AM treated RBCs).

