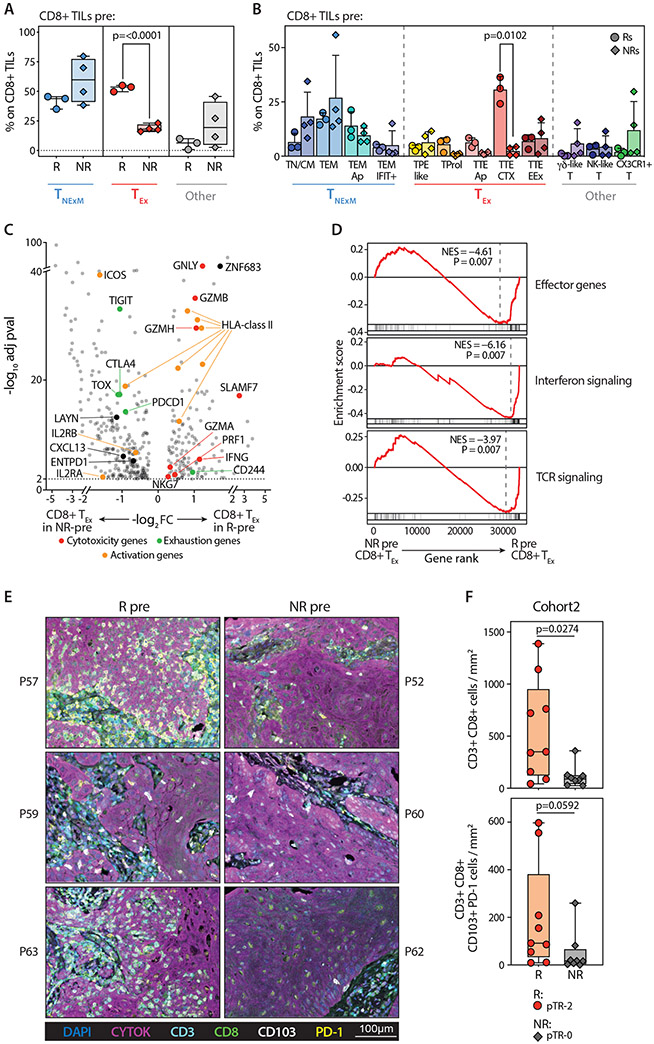
Fig. 3. CD8+ TILs before PD-1 blockade in responder and non-responder patients.
(A) Frequencies of principal phenotypes among CD8+ TILs collected from Responders (R, circles, n=3) or Non-Responders (NR, diamonds, n=4) at pre-treatment timepoints (Pre). Box plots - median percentage of TILs with phenotypes corresponding to CD8+ non-exhausted memory cell states (TNExM, blue), exhausted states (TEx, red), or unclassified clusters (Other, grey; see Fig. 2B). Whiskers: min-max values; horizontal bars: medians. Boxes: 25th-75th percentiles. P values: significant comparisons (two-tailed Welch’s t-test). (B) Proportions of CD8+ TILs from pretreatment biopsies (pre) collected from Rs (circles, n=3) and NRs (diamonds, n=4, Data File S4). Colors identify cell states, as inferred from cluster classification (Fig. 2B, Fig. S3) and are grouped based on association in primary clusters (x axis). P values of significant comparisons are shown, as calculated with two-tailed Welch’s t test. (C) Differentially expressed genes among CD8+ TEx-TILs detected in baseline biopsies in Responders (R, right, n=3) and Non-Responders (NR, left, n=3). Dots denote genes with adj-pval<0.01 (two-sided Wilcoxon Rank Sum test). Representative genes are labeled, with colors corresponding to gene-functions (legend). Genes enriched in baseline CD8+ TEx-TILs in patients with good or poor response after PD-1 blockade were selected from this comparison (log2FC>1) and included in signatures (Data File S5). (D) GSEA enrichment of the CD8+ TEx-TILs in pre-treatment biopsies from Rs (right, n=3) and NRs (left, n=3) for signatures of highly reactive T cells (10, 26, 27). P values were determined by one-tailed permutation test by GSEA. NES, normalized enrichment score. (E) Multiplexed Immunofluorescence of tumor biopsies collected prior to treatment from 3 Rs (left) and 3NRs (right) patients previously analyzed by scRNA-seq. The representative images demonstrate the pre-existing high levels of tissue resident memory-like (CD103+) and exhausted (PD1) TILs (CD3+ CD8+) in Rs within the tumor bed, marked by expression of cytokeratin (Cytok). Lower magnifications in Fig. S6B. (F) Quantification of CD3+ CD8+ TILs (top) or exhausted tissue-resident (PD-1+ CD103+) CD8+ TILs (bottom) infiltrating pre-treatment biopsies collected from 17 HNSCC before two doses of neoadjuvant pembrolizumab. Infiltrates were determined by enumerating the mean number of TILs cells in 6 representative 20× fields (see Material and Methods). Dots represent individual values in Responders (pTR-2, circles) and Non-Responders (pTR-0, diamonds), as reported in Data File S6. Number of analyzed patients and degree of pTR are reported in a legend (right). P values: significant comparisons calculated with two-tailed Mann-Whitney test.

