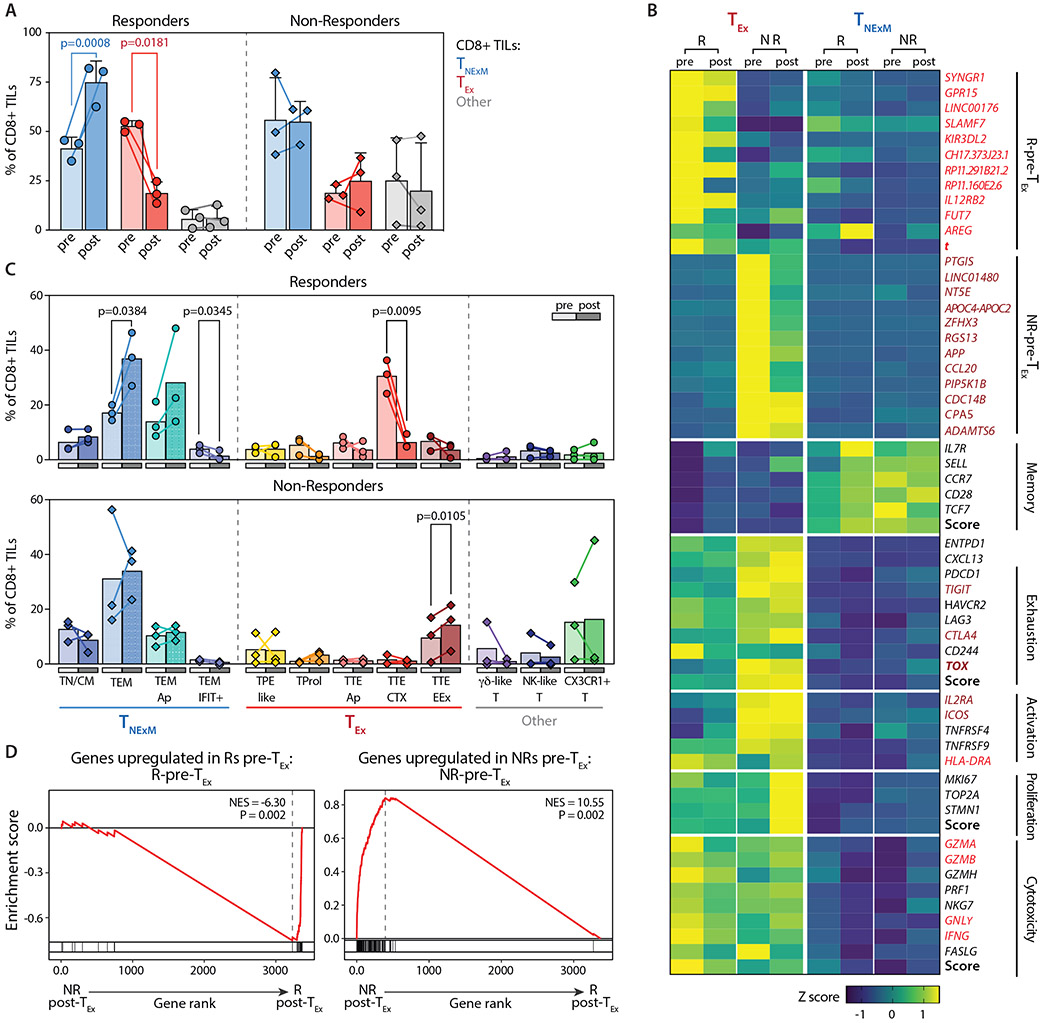
Fig. 4. Dynamics of CD8+ TIL subsets before and after PD-1 blockade in responder and non-responder patients.
(A) Frequencies of dominant phenotypes among CD8+ TILs in HNSCC lesions collected before (pre, light colors) or after (post, dark colors) neoadjuvant PD-1 blockade (Data File S4). Dots represent individual values in Rs (n=3, circles) and NRs (n=3, diamonds), Lines connect pre-post matched evaluations for each patient. Bars - means with SD and report percentage of TILs with different primary phenotypes (TNExM, blue; TEx, red; Other, grey; see Fig. 2B). P values: significant comparisons calculated with two-tailed ratio-paired t-test. (B) Heatmap reporting variation (expressed as Z-score) in average gene-expression measured in exhausted TEx (left) or memory TNExM (right) CD8+ TILs in pre- or post-treatment tumors collected from Rs and NRs. Qualitative differences are reported for top deregulated in CD8+ TEx-TILs (as established in Fig. 3C) or for representative T-cell related genes, divided based on their known function (left). Scores summarizing expression of genes in each category are depicted (bold, see Material and Methods). Genes included in signatures determined in Fig. 3C (see Data File S5) and enriched in R-Pre-TEx-TILs or NR-Pre-TEx-TILs are labeled in red and brown respectively. Key transcriptional factors are highlighted in bold. (C) Comparison of frequencies of CD8+ TIL-subsets analyzed before (pre: light colors) or after (post: full colors) treatment (Data File S4). Bars shows mean values, as measured in Responder (circles, top, n=3) and Non-Responders (diamonds, bottom, n=3) with available matched tumor biopsies. Colors identify cell states, which are grouped based of association in primary clusters (x axis, see Fig. 2B)). Significant P values calculated using two-sided paired t-test are shown. (D) GSEA enrichment for signatures predictive of response, enriched in R-Pre-TEx-TILs (top) or NR-Pre-TEx-TILs (bottom), as previously assessed (see panel Fig. 3C, Data File S5). Normalized enriched score (NES) is inferred comparing CD8+ TEx-TILs in post-treatment biopsies from Responders (right, n=3) or Non-Responders (left, n=3). Results show that signatures determined before therapies are still enriched in corresponding responder or non-responder patients after immunotherapy. P values were determined by one-tailed permutation test by GSEA.

