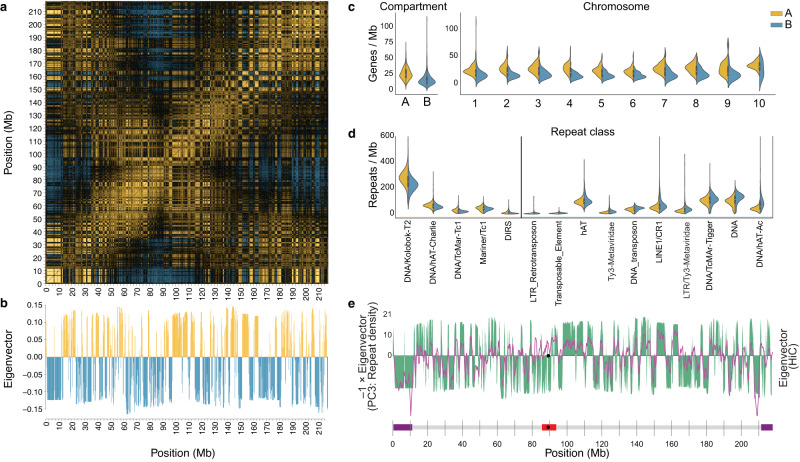
Fig. 5. A/B-compartment structure and gene/repeat densities.
a Correlation matrix of intra-chromosomal Hi-C contact densities between all pairs of nonoverlapping 250 kb loci on chromosome 1. Yellow and blue pixels indicate correlation and anti-correlation, respectively, and reveal which genomic loci occupy the same or different chromatin compartment. Black pixels indicate weak/no correlation. b The first principal component (PC) vector revealing the compartment structure along chromosome 1, obtained by singular value decomposition of the correlation matrix in panel a. Yellow (positive) and blue (negative) loadings indicate regions of chromosome 1 partitioned into A and B compartments, respectively. c Gene density (genes per megabase) distributions in A (yellow) vs. B (blue) compartments genome-wide and per chromosome. Sample sizes and significance statistics provided in Supplementary Table 20. d Repeat classes significantly enriched by density (repeats per megabase) in A (yellow) vs. B (blue) compartments. Sample sizes and significance statistics provided in Supplementary Table 20. Each boxplot summarizes the combined (A + B) density distribution (Y-axis) per class (X axis); lower and upper bounds of each box (black) delimit the first and third quartiles, respectively, and whiskers extend to 1.5 times the interquartile range, while the median per class is represented as a filled white circle. e The PC3 loadings (purple line) from the repeat density matrix inversely correlate with alternating A/B-compartment loadings (green) for chromosome 1. See Supplementary Fig. 5b for all chromosomes. Purple rectangles plotted on the X axis denote subtelomeric regions, the red rectangle spans the pericentromere, and the black point marks the median centromere-associated tandem repeat position. Mb megabases. Source data are provided as a Source Data file.

