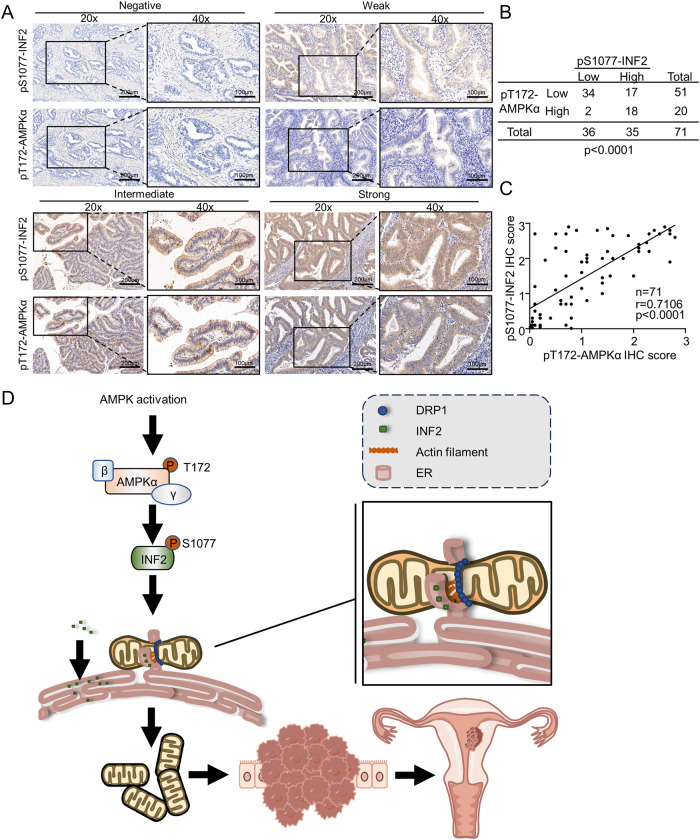
Fig. 6. Histopathological verification of the correlation between AMPK activation and INF2 Ser1077 phosphorylation level.
A Representative images of IHC staining of 71 EC specimens with AMPKα (phospho-Thr172) and INF2 (phospho-Ser1077) antibodies. B, C Statistical analysis of the IHC experiments in (A). D A schematic model summarizing the findings of the present study generated by Figdraw (https://www.figdraw.com/). P values are calculated using Fisher’s exact test in (B) and Spearman’s rank correlation test in (C).

