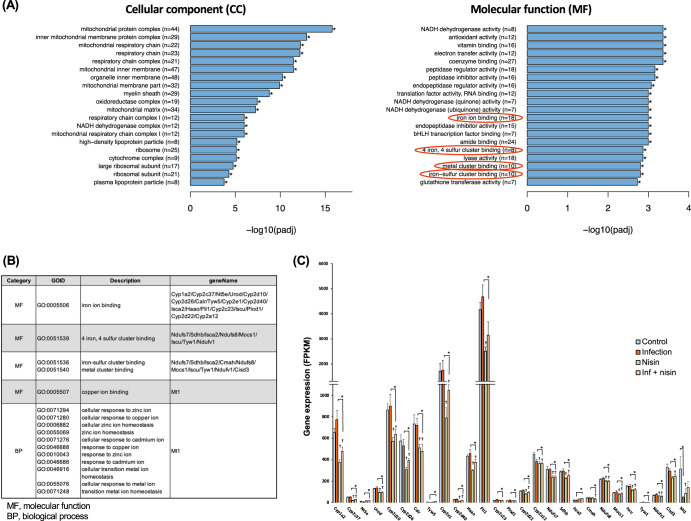
Fig. 10. Functional analysis expressed genes in liver tissue for GO pathways.
A Bar plot shows for top 20 significantly enriched GO terms at molecular function category, which were determined between the infection group and the inf. + nisin group by ClusterProfiler (version 3.8.1). B Related genes of iron binding and metal cluster binding in GO database. C The bar graph reveals differential genes among four groups for the iron binding-, metal cluster binding-, and cellular response to metal ion- related genes (*: adjusted i-value by FDR < 0.05 with pairwise t test, n = 6). The data are shown as means ± standard deviation.

