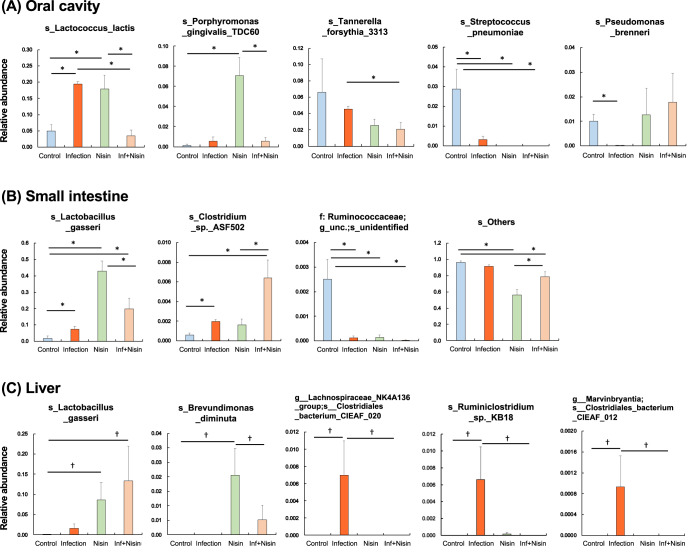
Fig. 2. Nisin shifted the microbiome from a disease-associated state toward a healthy state through multiple body sites.
Bar plots show bacterial taxa that exhibited significant differences in relative abundances at the species level within the oral cavity (A), small intestine (B) and liver (C). The data in the bar graphs are shown as means ± standard deviation. *p < 0.05 between groups with Tukey test, †p < 0.05 with t test (n = 6).

