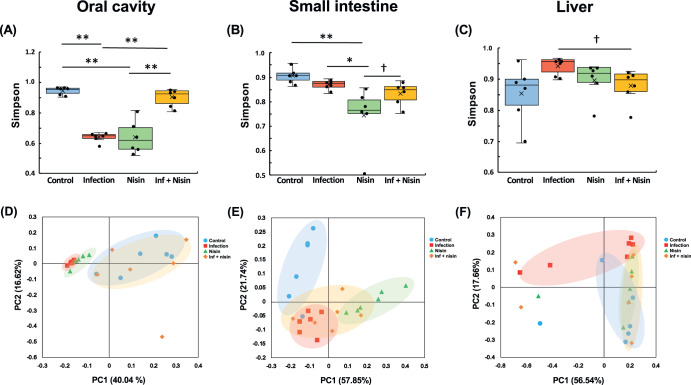
Fig. 3. Nisin prevents the alterations in microbial diversity and community structure induced by a polymicrobial infection in the oral cavity, small intestine, and liver.
Simpson index for analysis of alpha diversity (A–C). PCoA using weighted UniFrac distance for evaluating differences in microbiome composition between groups (D–F). Box-plots display the median, first quartiles (25th percentile), third quartiles (75th percentile), and minimum and maximum whiskers, with all data points plotted. *p < 0.05 and **p < 0.01 between groups with Tukey test, †p < 0.05 with t test (n = 6).

