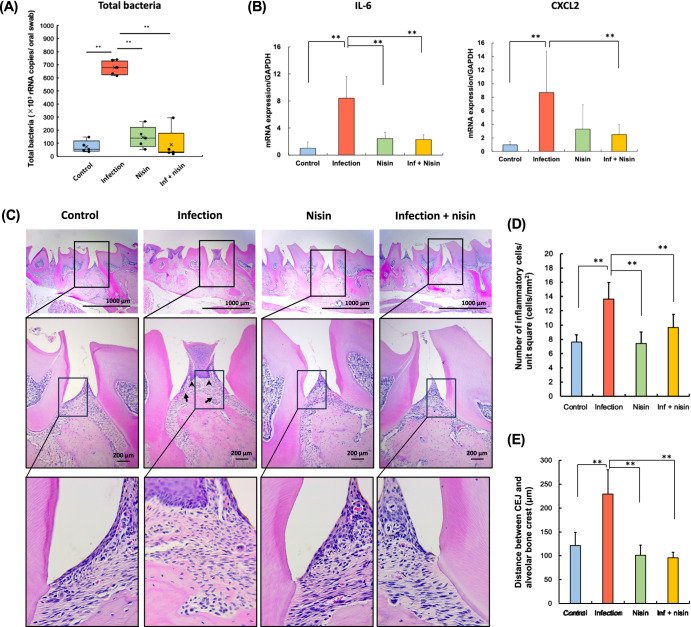
Fig. 4. Periodontal inflammation following polymicrobial oral infection is reduced by nisin.
A Total bacteria amount, (B) Gene expression of pro-inflammatory cytokine, and (C) Histopathological evaluation in periodontal tissue of the maxillary specimens (Scale bar: 1000 μm in the upper panel and 200 μm in the lower panel, respectively). D The number of inflammatory cells per 1.0 mm2 of connective tissue, and (E) Average calculated linear distance between the CEJ and ABC in histological image. The data in the bar graphs are shown as means ± standard deviation. Box-plots display the median, first quartiles (25th percentile), third quartiles (75th percentile), and minimum and maximum whiskers, with all data points plotted. *p < 0.05 and **p < 0.01 between groups with Tukey tests for real-time PCR analysis (n = 5) and histological analysis (n = 3), respectively.

