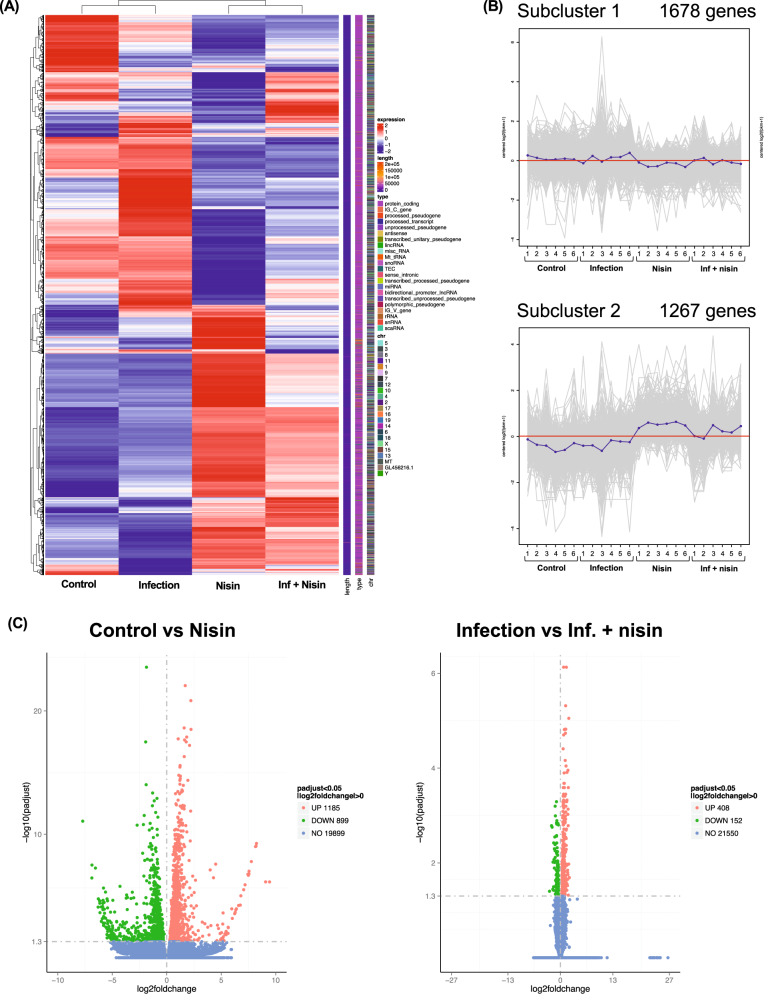
Fig. 8. Gene profile in liver tissue analyzed by RNA sequencing.
A RNA-seq detected 2,949 genes were categorized by hierarchical clustering approach (n = 6). B Subcluster analysis were further performed to determine the trends in gene expressions among groups. C Volcano plot revealed 2,084 DEGs (1185 up-regulated and 899 down-regulated) between the control group and the nisin group (left panel) and 560 DEGs (408 up-regulated and 152 down-regulated) between the infection group and the inf. + nisin group (right panel).

