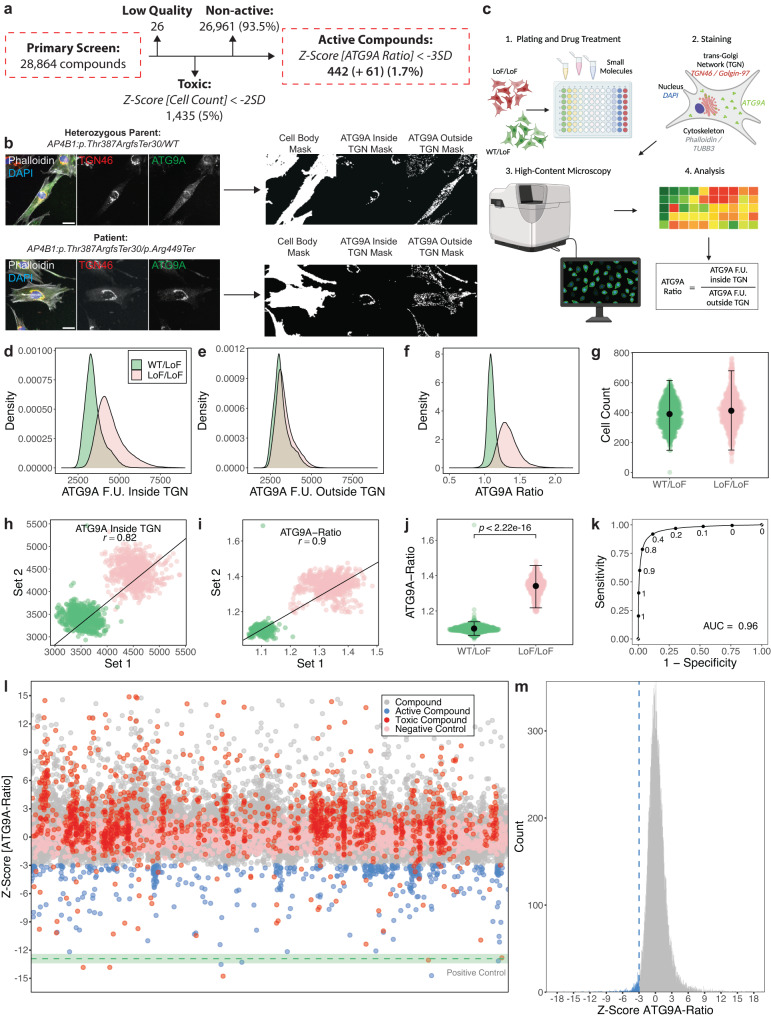
Fig. 1. Establishment of a cell-based phenotypic small molecule screening platform using ATG9A translocation as a surrogate for AP-4 function and primary screening of 28,864 small molecule compounds.
a Overview of the primary screen of 28,864 small molecules in fibroblasts from a patient with bi-allelic LoF variants in AP4B1. b Illustration of the automated image analysis pipeline. Representative images of patient fibroblasts (negative control, LoF/LoF) and their sex-matched heterozygous parent (positive control, WT/LoF) are shown. Scale bar: 20 µm. c Overview of the high-throughput platform. Created with BioRender.com. d–f Distribution of ATG9A fluorescence intensities inside (d) and outside (e) the TGN, as well as ATG9A ratios (f) on a per cell basis (nWT/LoF = 99,927, nLoF/LoF = 119,522). g Cell counts as per well means of 1312 wells per condition from 82 independent plates. Means are shown as black dots; whiskers represent ±1.5 x IQR. h, i Replicate plots were generated by random sampling of the 82 plates from the primary screen in two groups. Similar positions on the assay plates were plotted against each other with respect to ATG9A fluorescence intensities inside the TGN (h) and ATG9A ratios (i). Replicate correlations were assessed by averaging the Pearson correlation coefficients (r) of 100 random sampling tests. j Discriminative power of the ATG9A ratio in separating positive and negative controls. Statistical testing was done using the Mann-Whitney U test. P-values are two-sided. Data points represent per well means of 1312 wells per condition from 82 independent plates. Means are shown as black dots; whiskers represent ±1.5 x IQR. k To test the robustness of separation of the ATG9A ratio between positive and negative controls, a dataset containing measurement for 99,927 WT/LoF and 119,522 LoF/LoF cells was partitioned into a training set (70% of data) and a test set (30%). The performance of a generalized linear model is shown in (k). The AUC is 0.96. l Impact of 28,864 compounds applied for 24 h at a concentration of 10 µM. Z-scores for the ATG9A ratio are shown. All data points represent per well means. The mean of the positive control is shown as a green dotted line. The green shaded areas represent ± 1 SD. m Distribution of Z-scores of all non-toxic 27,403 compounds. Active compounds are highlighted in blue.

