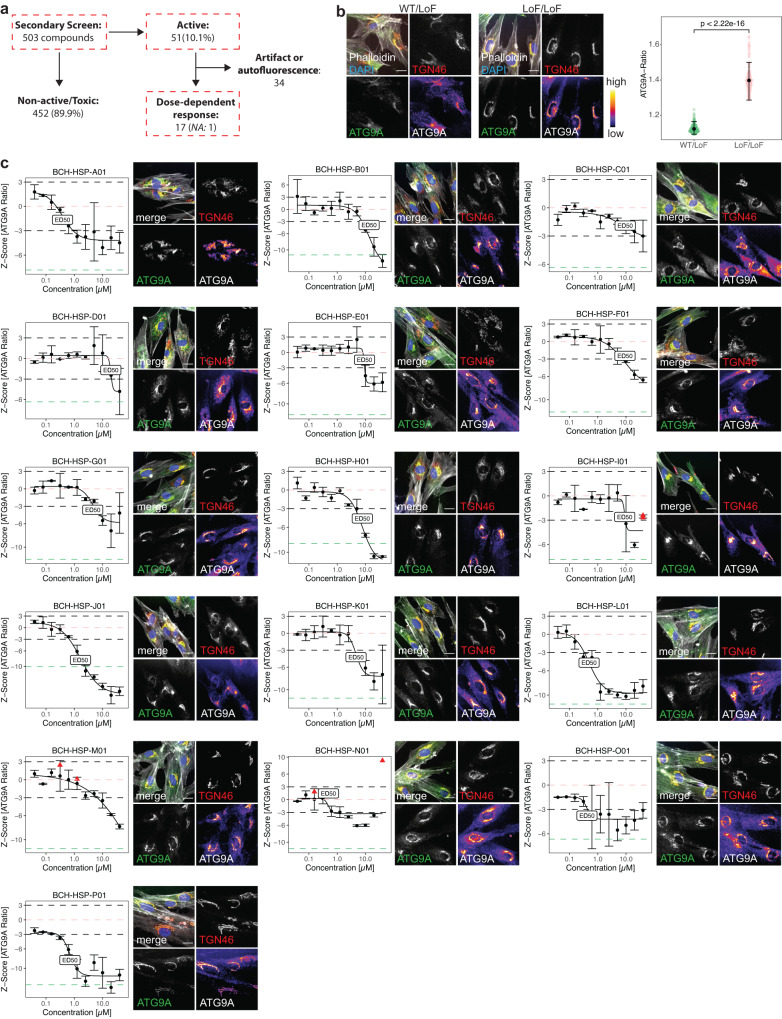
Fig. 2. Counter-screen in fibroblasts from AP-4-HSP patients confirms 16 compounds that lead to dose-dependent redistribution of ATG9A.
a Overview of the counter-screen of the 503 active compounds identified in the primary screen. To assess for dose-dependent effects, compounds were screened in AP-4-HSP patient-derived fibroblasts in 384-well microplates using 11-point titrations ranging from 40 nM to 40 µM. All concentrations were screened in duplicates. Active compounds were a priori defined as those reducing the ATG9A ratio by at least 3 SD compared to negative controls in more than one concentration. Toxicity was defined as a reduction of the cell count of at least 2 SD compared to negative controls. b Baseline differences in the ATG9A distribution in WT/LoF (n = 269) vs. LoF/LoF (n = 269) fibroblasts. Data points represent per well means of 269 wells per condition from 17 independent plates. Means are shown as black dots; whiskers represent ±1.5 x IQR. Statistical testing was done using the Mann-Whitney U test. P-values are two-sided. c Dose-response curves were fitted using a four-parameter logistic regression model, and EC50 concentrations were calculated. All concentrations were tested in biologic duplicates. Black dots and error bars represent mean ± 1 SD. Black dashed lines represent the a priori-defined thresholds of ± 3 SD compared to the negative control (LoF/LoF). Red triangles represent toxic concentrations based on the a priori-defined threshold of a reduction of cell counts of at least 2 SD compared to the negative control. The salmon-colored dashed line represents the mean of negative controls, while the green-colored dashed line depicts the mean of the positive controls (WT/LoF). Representative images of the EC50 are shown for each active compound. Representative images show a merge of the 4 channels: Phalloidin (gray), DAPI (blue), TGN46 (red) and ATG9A (green), as well as the TGN46 and ATG9A channels in greyscale. For a better illustration of differences in ATG9A signals, the fluorescence intensities of the ATG9A channel are additionally shown using a color lookup table. Scale bar: 20 µm. NA: not available.

