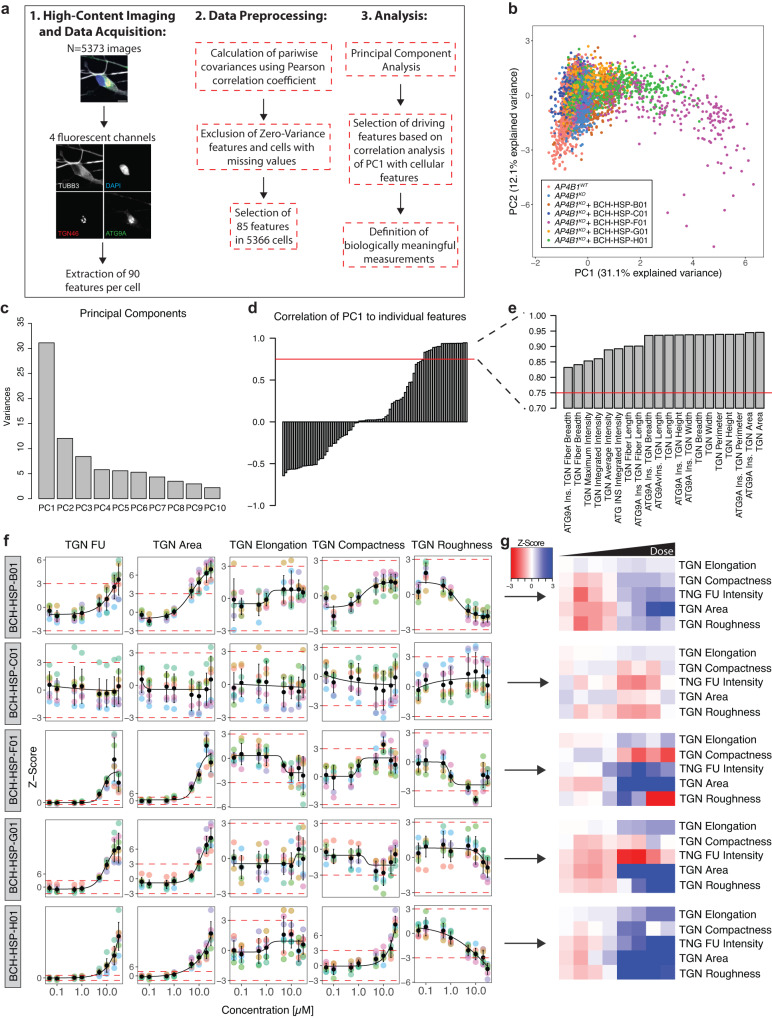
Fig. 4. Multiparametric profiling of 5 active compounds in AP4B1KO SH-SY5Y cells.
a Multiparametric profiles of images of 5373 cells were acquired using 4 fluorescent channels. Scale bar: 10 µm. A total of 90 measurements per cell were generated for the cytoskeleton (beta-3 tubulin), the nucleus (DAPI), the TGN (TNG46) and ATG9A vesicles (ATG9A). The different steps of data preprocessing and phenotypic clustering using principal component analysis (PCA) are shown. b PCA shows different clusters of cells based on 85 phenotypic features. Experimental conditions are color-coded. The first two principal components (PC1 and PC2) explain 43.2% of the observed variance. c Bar plot summarizing the variance explained by the first 10 PCs. Most of the variance is explained by PC1 and, to a lesser degree, PC2. d Correlation analysis of PC1 with all 85 features using the Pearson correlation coefficient. The red dashed line represents a cutoff for correlations >0.75. e Zoom-in on selected features of interest showing a correlation with PC1 >0.75. f Measurements of TGN intensity and descriptors of TGN shape and network complexity for the individual hit compounds as line graphs. Data points represent per well means of 7 independent plates. Black dots and error bars represent mean ± 1 SD. g Information on TGN summarized using heatmap visualization.

