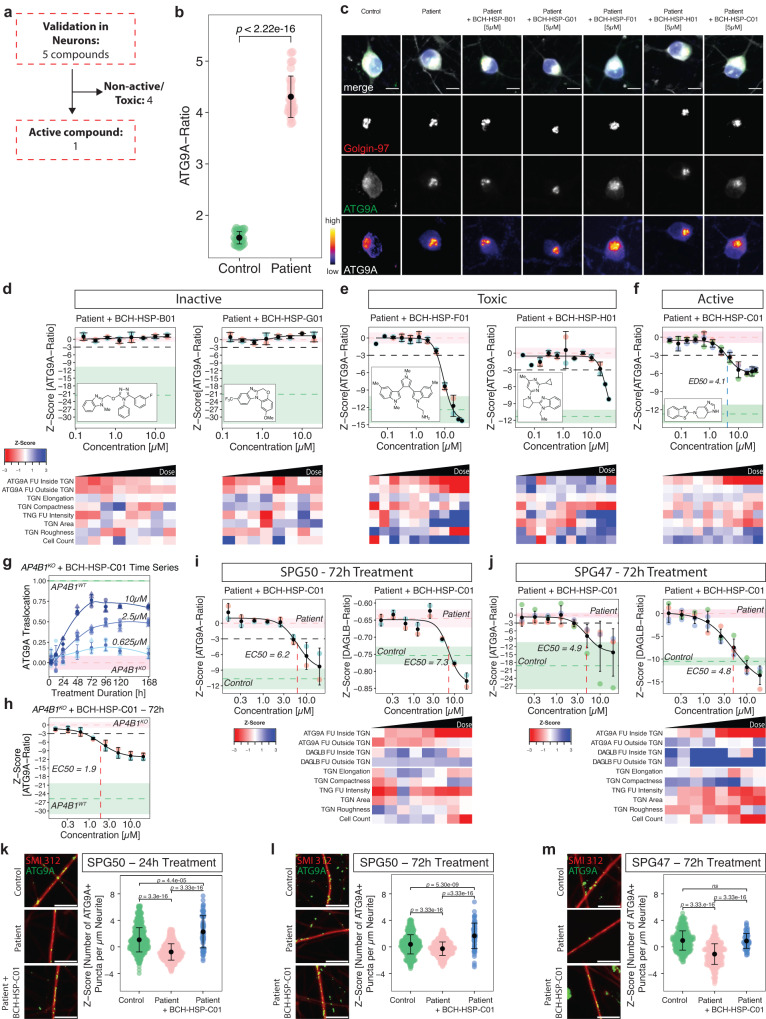
Fig. 5. BCH-HSP-C01 restores ATG9A and DAGLB trafficking in hiPSC-derived neurons from AP-4-HSP patients.
a Overview of 5 active compounds in hiPSC-derived cortical neurons from a patient with AP4M1-associated SPG50 compared to same-sex parent (heterozygous control). b Baseline differences of ATG9A ratios using per well means of 60 wells per condition from 5 plates. Means are shown as black dots; whiskers represent ±1.5 x IQR. Statistical testing was done using the Mann-Whitney U test. P-values are two-sided. c Representative images of hiPSC neurons treated with individual compounds at 5 µM for 24 h. Scale bar: 10 µm. d–f Dose-response curves for ATG9A ratios in hiPSC-derived neurons from a patient with SPG50 treated with individual compounds for 24 h, along with their morphological profiles depicted as heatmaps. All data points represent per well means of 2 (d, e), or 4 (f) independent differentiations. Black dots and error bars represent mean ± 1 SD. Dashed lines show mean Z-scores for positive (green) and negative (salmon) controls. Shaded areas represent ± 1 SD. g Time-series experiment of AP4B1KO SH-SY5Y cells treated with BCH-HSP-C01 with different concentrations and treatment durations. Data points represent per well means of two independent plates. Shapes indicate technical replicates. Dashed lines show mean Z-scores for positive (green) and negative (salmon) controls. Shaded areas represent ± 1 SD. h Dose-response curve for ATG9A ratios in AB4B1KO SH-SY5Y cells treated with BCH-HSP-C01 for 72 h. Data points represent per well means from two independent plates. Dashed lines show mean Z-scores for positive (green) and negative (salmon) controls. Shaded areas represent ± 1 SD. i, j Dose-response curves for ATG9A and DAGLB ratios in hiPSC-derived neurons from a patient with SPG50 (i) and SPG47 (j) after prolonged treatment with BCH-HSP-C01 for 72 h, along with morphologic profiles. Data points represent per well means of 2 independent differentiations. Dashed lines show mean Z-scores for positive (green) and negative (salmon) controls. Shaded areas represent ± 1 SD. k–m Quantification of ATG9A positive puncta per neurite length in hiPSC-derived neurons from a patient with SPG50 following 24 h of BCH-HSP-C01 treatment (k, nWT/LoF = 837, nLoF/LoF = 848, nLoF/LoF + BCH-HSP-C01 = 72), as well as hiPSC-derived neurons from patients with SPG50 (l, nWT/LoF = 843, nLoF/LoF = 843, nLoF/LoF + BCH-HSP-C01 = 70) and SPG47 (m, nWT/LoF = 424, nLoF/LoF = 428, nLoF/LoF + BCH-HSP-C01 = 70) treated for 72 h with BCH-HSP-C01. All data points represent means of single images from two independent differentiations. Statistical testing was done using the Mann-Whitney U test. P-values are two-sided and were adjusted for multiple testing using the Benjamini-Hochberg procedure. Representative images are shown for all experimental conditions. Scale bar: 10 µm.

