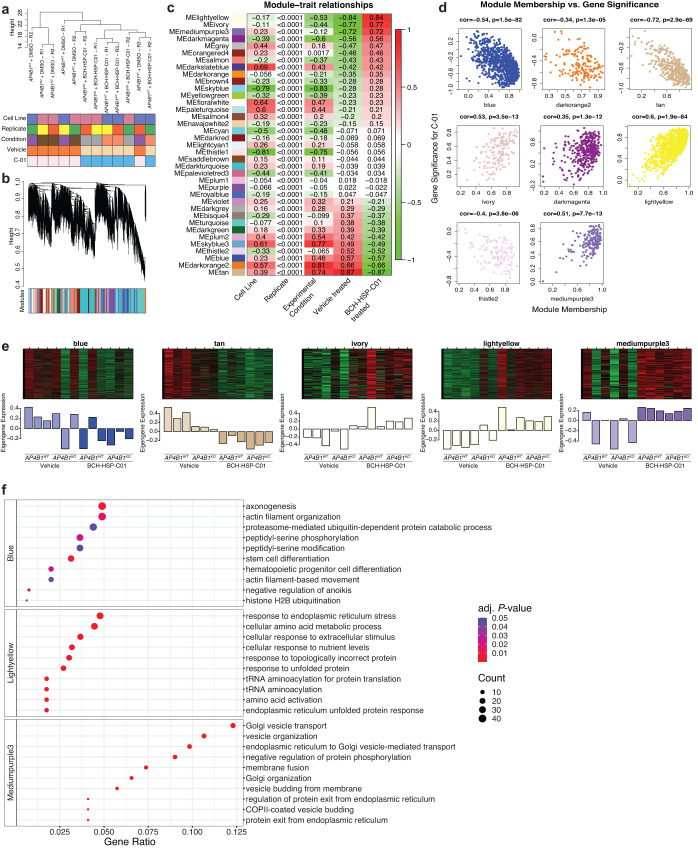
Fig. 6. Target deconvolution using bulk RNA sequencing and weighted gene co-expression network analysis in AP4B1KO SH-SY5Y cells treated with BCH-HSP-C01.
a Hierarchical clustering of 12 samples using average linkage showed two main clusters based on treatment with vehicle vs. BCH-HSP-C01, irrespective of cell line. b Cluster dendrogram of 18,506 expressed genes based on topological overlap. Clusters of co-expressed genes (“modules”) were isolated using hierarchical clustering and adaptive branch pruning. c Heatmap visualization of the correlation of gene expression profiles (“module eigengene”, ME) of each module with measured traits. Pearson correlation coefficients are shown for each cell of the heatmap. d Intramodular analysis of module membership (MM) and gene significance (GS) for highly correlated modules, allowing identification of genes that have high significance with treatment as well as high connectivity to their modules. Statistical testing was done using the t-test. P-values are two-sided. e ME expression profiles for the top 5 co-expressed modules. f Gene ontology enrichment analysis showed enriched pathways in 3/5 modules. Statistical testing was done using the hypergeometric test. P-values are one-sided. Pathways were considered differentially expressed with an FDR <0.05.

