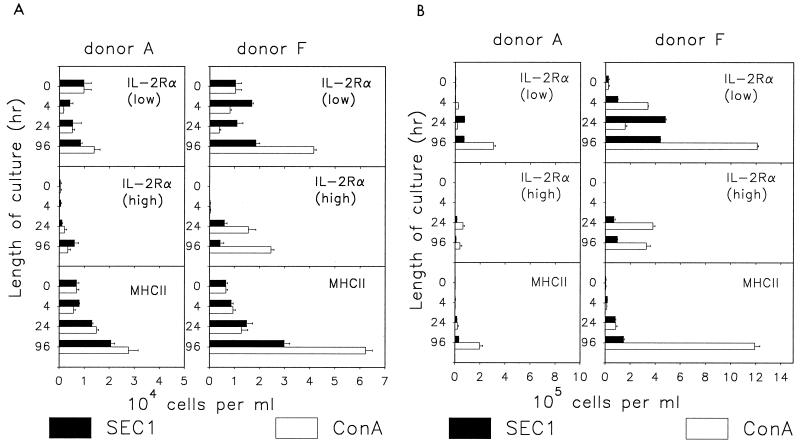
FIG. 4.
Expression of IL-2Rα and MHCII on subpopulations of bovine γδ T cells in PBMC cultures stimulated with SEC1 or ConA. Data are numbers of cells positive for a given marker (mean ± SEM of three measurements obtained in a representative experiment). The cells positive for IL-2Rα are separated into nonoverlapping populations characterized by small or large amounts of the receptor on the cell surface. (A) γδ CD2+ CD8+ cells; (B) γδ CD2− cells. Notice the different scale in panels A and B.

