
Figure 3.
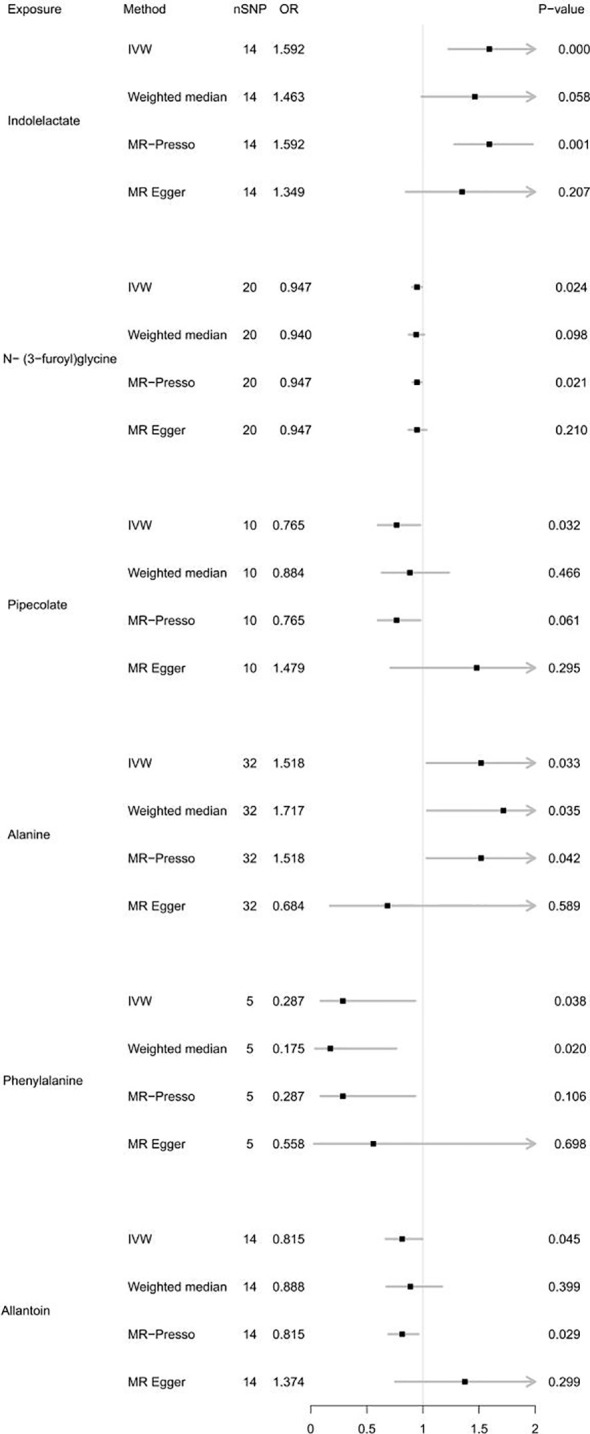
Forest plot of MR results for gut metabolites on autoimmune hypothyroidism. Method, statistical analysis methods; nSNP, number of SNPs; OR, odds ratio; P-value, significance P-value.
Official websites use .gov
A
.gov website belongs to an official
government organization in the United States.
Secure .gov websites use HTTPS
A lock (
) or https:// means you've safely
connected to the .gov website. Share sensitive
information only on official, secure websites.
Forest plot of MR results for gut metabolites on autoimmune hypothyroidism. Method, statistical analysis methods; nSNP, number of SNPs; OR, odds ratio; P-value, significance P-value.