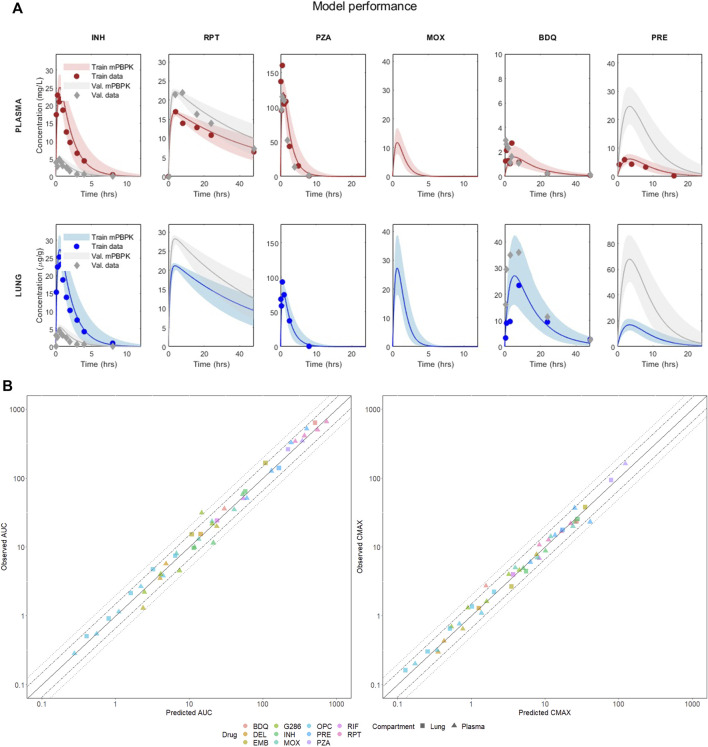
FIGURE 2.
(A) Visual predictive check of the mPBPK model for six drugs in plasma and lung. The figure shows the performance in training and validation for the mPBPK model in plasma and lung. All figures show the median of the simulated VP (solid line) and the five and ninety-five percentiles (shaded area); dots represent the experimental data at each time point (or their mean if multiple measurements were available). Red refers to the training sets in plasma, blue to the training sets in lungs, and grey are the validation sets. INH—isoniazid (training 25 mg/kg, validation 5 mg/kg); RPT—rifapentine (training 15 mg/kg, validation 20 mg/kg); PZA—pyrazinamide (training 150 mg/kg, validation 150 mg/kg); MOX—moxifloxacin (training 100 mg/kg, validation 100 mg/kg); BDQ—bedaquiline (training 25 mg/kg, validation 25 mg/kg); PRE—pretomanid (training 25 mg/kg, validation 100 mg/kg). (B) Correlation plots between observed and best-fit predicted AUCs and Cmax, color-coded for drugs and shape-coded for compartments. Solid lines are the theoretical perfect agreement reference lines (bisector), while the dashed lines mark the 1.5- and two-fold from reference. Observed AUCs are computed via the trapezoidal rule.

