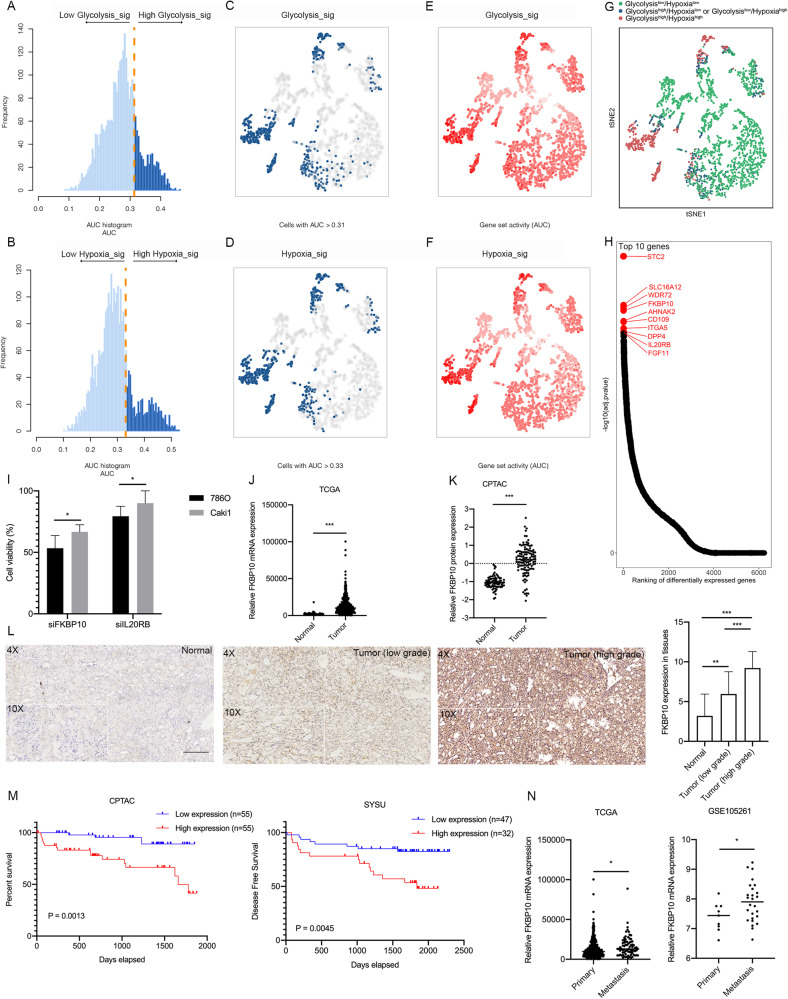
Fig. 1. FKBP10 may play an important role in ccRCC progression and indicate poor prognosis in ccRCC patients.
A, B The distribution of AUC and cell frequency. C, D tSNE diagrams for cells with AUCs higher than the selected threshold. Blue dots indicate cells with higher AUC scores, and gray dots indicate cells with lower AUC scores. E, F tSNE diagrams for glycolysis-sig and hypoxia-sig activities that colored by AUC. G The tSNE diagram of three groups divided by glycolysis-sig and hypoxia-sig. H Ranking plot according to P values. I Cell viability assay of 786 O cells in different treatment groups for 72 h. J, K FKBP10 expression in ccRCC and normal kidney tissues from TCGA-KIRC or CPTAC-KIRC datasets. L Representative images of FKBP10 immunohistochemistry staining in ccRCC and adjacent normal tissues. Scale bar: 100 µm. The histogram indicates the IHC scores of FKBP10 expression. M Kaplan‒Meier curves for OS or DFS between the FKBP10 low and high expression groups. N FKBP10 expression in primary ccRCC tissues and metastatic ccRCC tissues from TCGA or GSE105261. The data are shown as the means ± SD. Statistical analyses were performed with a two-tailed unpaired Student’s t test (*P < 0.05, **P < 0.01, ***P < 0.001).

