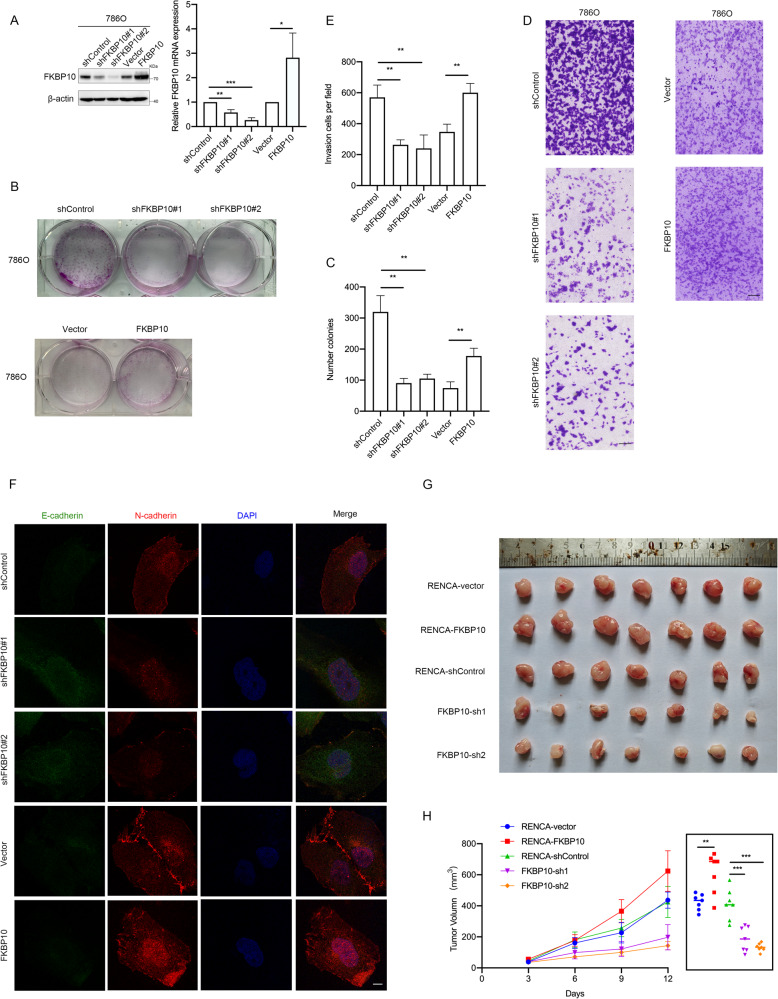
Fig. 2. FKBP10 promotes ccRCC proliferation, migration and invasion.
A The overexpression or knockdown of FKBP10 in 786 O cells was measured by Western blot and qRT‒PCR assays. B, C Cell proliferation abilities were measured by colony formation assays. D, E Cell invasion abilities were measured by Transwell assays. Scale bar: 100 µm. Data are presented as the means ± SD, and were independently replicated three times. F Representative images of immunofluorescence staining for E-cadherin (green) and N-cadherin (red) (magnification ×100). DAPI (blue) was applied for nuclear staining. Scale bar: 10 µm. G, H Gross appearance of the tumors and tumor growth curves of each group are shown. Statistical analyses were performed with a two-tailed unpaired Student’s t test (NS, P > 0.05, * P < 0.05, **P < 0.01, ***P < 0.001).

