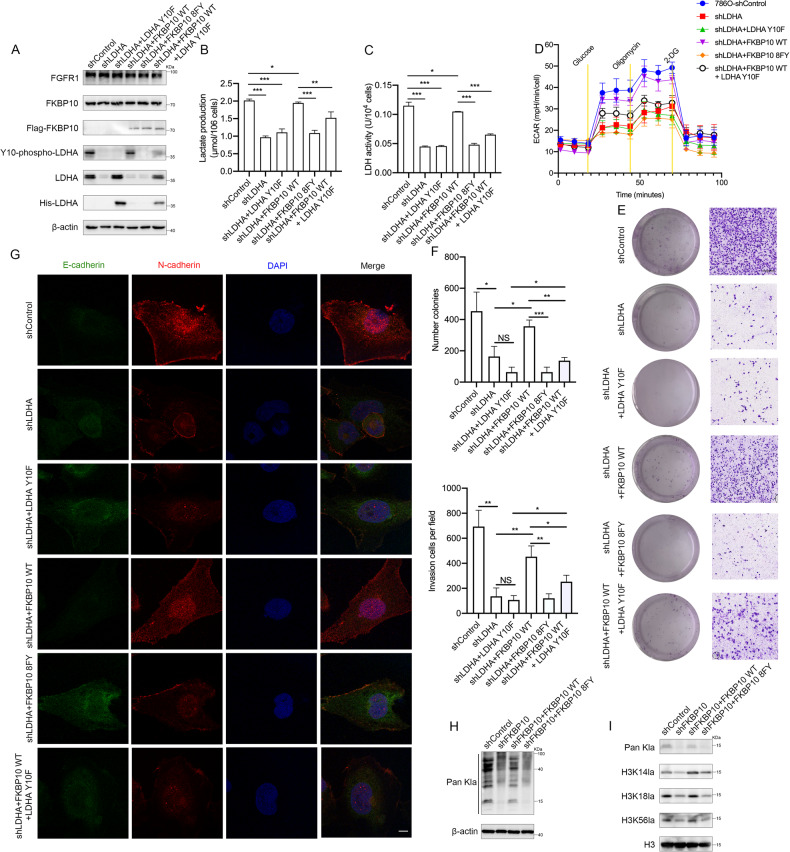
Fig. 6. FKBP10 promotes glycolysis and ccRCC progression via LDHA-Y10 phosphorylation.
A Western blot analysis of the LDHA-Y10 mutation. B, C Lactate production and LDH enzyme activity were examined in 786 O cells with the LDHA-Y10 mutation. D ECAR analysis of 786 O cells in (A). E, F Cell proliferation abilities were measured by colony formation assays. Cell invasion abilities were measured by Transwell assays. Scale bar: 100 µm. Data are presented as the means ± SD, and were independently replicated three times. G Representative images of immunofluorescence staining for E-cadherin (green) and N-cadherin (red) (magnification ×100). DAPI (blue) was applied for nuclear staining. Scale bar: 10 µm. H Western blot analysis of Pan Kla in 786 O cells as indicated. I Western blot analysis of histone Pan Kla levels, H3K14la, H3K18la and H3K56la in 786 O cells as indicated. Statistical analyses were performed with a two-tailed unpaired Student’s t test (* P < 0.05, **P < 0.01, ***P < 0.001).

