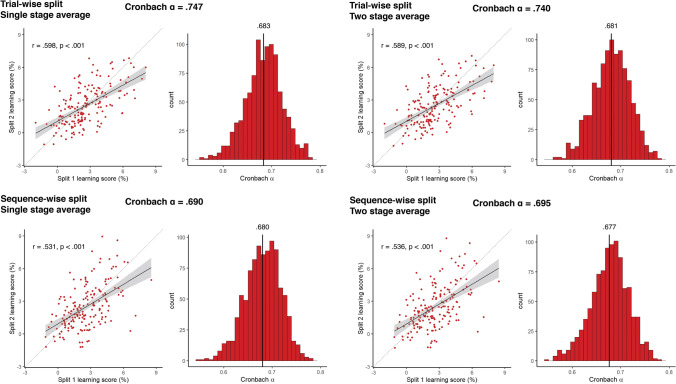
Fig. 3.
Reliability metrics for accuracy-derived learning scores. The four panels show the results of the four methods of reliability calculation that differ in pre-processing choices. In each panel the Cronbach alpha on top of each panel shows the obtained alpha from the simple sequential assignment of trials, and its 95% CI calculated with Feldt's procedure. Scatterplots show learning scores the raw correlation between learning scores for the two splits, one dot corresponding to one subject. Learning scores are in units of differences in reaction times for the two triplet types. The trendline shows linear fit, bands correspond to 95% CI. The dashed line shows the identity line. We also indicate the split-half Pearson's correlation and its p value, as well as 95% CI. Histograms show the results of the two permutation analyses, on the left, the distribution of Cronbach alphas resulting from trial resampling along with its mean, on the right, the bootstrapped distribution of Cronbach alphas, along with its mean, and the bootstrapped 95% CI values

