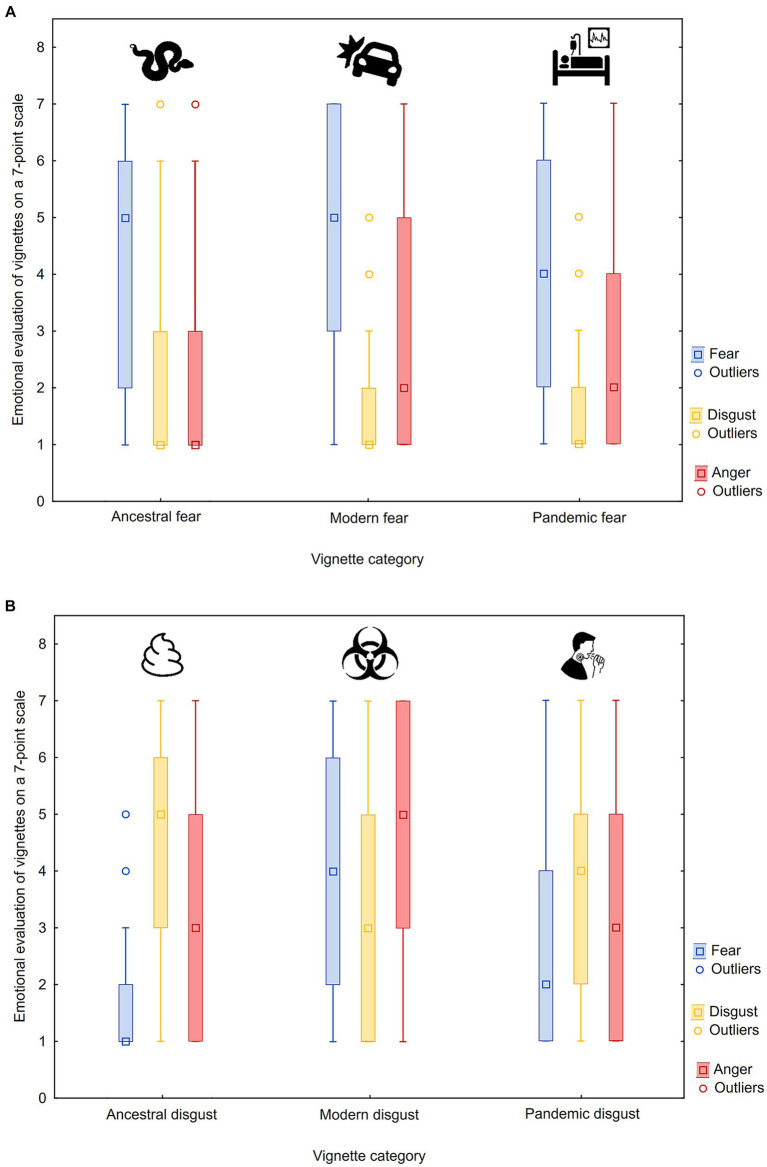
Figure 1.
Graphical representation of fear, disgust, and anger ratings of vignettes representing potential threat for humans (using raw scores). Six vignette categories are divided into two graphs for a better clarity: fear vignettes (A) and disgust vignettes (B) according to the expected predominant negative emotion. Median (middle point), lower and upper quartiles (box range) and non-outlier minimum and maximum values (whiskers) are provided together with outlier points.

