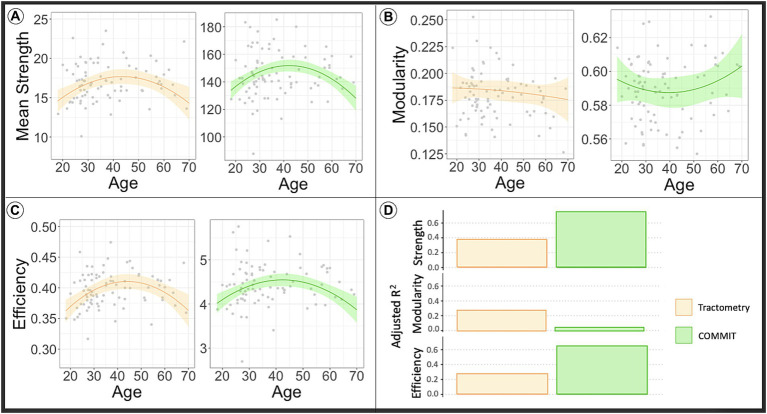
Figure 3.
The line in the plot shows the predicted values of network metrics [(A) Mean strength, (B) modularity, (C) efficiency] while raw network metrics values are reported as gray dots. Based on the model to assess the impact of age in the global network metrics considering sex and WM volume as covariates, we predicted the global network metrics for age in range 20–70. We fixed sex as males and WM volume as the average value found in our sample. In orange are reported the predicted network metrics from the model fitted on Tractometry weighted connectomes, while in green are reported the network metrics computed using COMMIT. In panel (D) we reported the plot of the adjusted R2 values for each model. High R2 indicates that a lot of variance in the data is explained by the model. As first observation we can say that myelin-weighted network metrics peak around forty in all the models. On the other hand, we see a bigger R2 in case of COMMIT indicating its capacity to offer more precise estimates of diffusion-weighted connectivity in comparison to Tractometry. COMMIT, Convex Optimization Modeling for Microstructure Informed Tractography; INVF, intra-neurite volume fraction.

