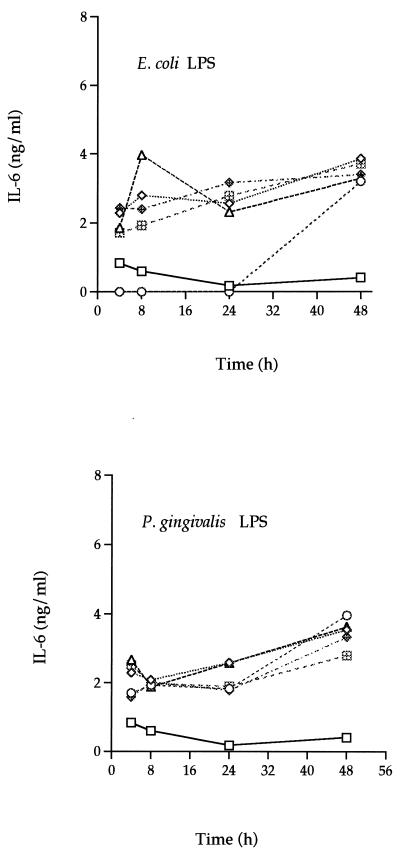
FIG. 3.
Dose-response and time course analysis of IL-6 secretion by E. coli LPS- or P. gingivalis LPS-stimulated F-CL (P4) fibroblasts. Various amounts (10 pg/ml [◊] 1 ng/ml [○], 100 ng/ml [▵], 1 μg/ml [⊞], and 10 μg/ml [◊+]) of E. coli or P. gingivalis LPS were added to confluent cultures of F-CL fibroblasts and incubated for 4, 8, 24, or 48 h. IL-6 protein in the culture supernatant was determined by ELISA. The values are the means of duplicate determinations. The variation associated with each point is within 1 SD of the mean. □, control.

