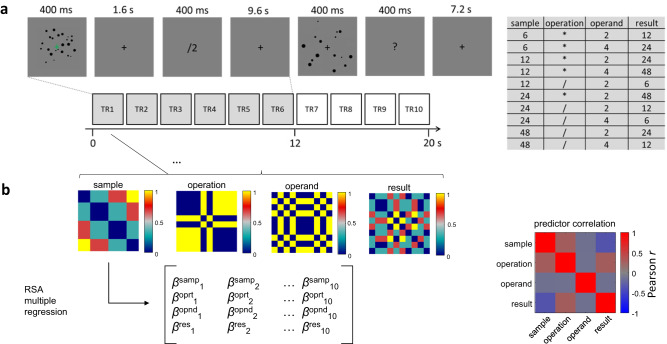
Fig. 1. Experimental Paradigm and analytic approach.
A Illustrates an experimental trial where subjects were briefly presented with a cloud of visual items from which they had to extract its approximate numerosity, followed by a symbolic cue instructing them which operation to perform on it. The result of the operation then had to be maintained in memory over a prolonged delay period (9.6 s on standard trials as shown here, randomly shortened on a smaller subset of additional catch trials). At the end of the delay period, another cloud of items appeared on the screen, which required a smaller/larger decision in comparison with the internally maintained result of the operation. The total trial duration (delay between two sample presentations) was 20 s. The 10 experimental conditions used, based on the combination of four different sample numerosities with two operations and two operands, are shown on the right. B Illustration of inputs to the pattern analysis employed to disentangle the stimulus-evoked and internally generated representations of quantities from other components of the computation: 4 predictor matrices reflecting the Euclidean distances of these conditions in terms of sample numerosity, operation, operand, and result numerosity (on a logarithmic scale), here color scaled between 0 and 1 for visualization purposes, were entered all together into a multiple regression to predict the fMRI pattern similarity across the 10 conditions for each acquired fMRI data volume (TR corresponds to time of repetition of one volume). The multiple regression yielded estimates of effect sizes (β) for sample (samp), operation (oprt), operand (opnd), and result (res) predictors. The correlations between individual predictors are shown on the right. While it is generally impossible to entirely decorrelate in- and outputs of calculation tasks from each other and from the operation at the same time, our specific conditions were chosen such that sample and result predictors were roughly equally correlated with the operation predictor, and sample and result predictors were slightly negatively correlated with each other (Pearson r = −0.34).

