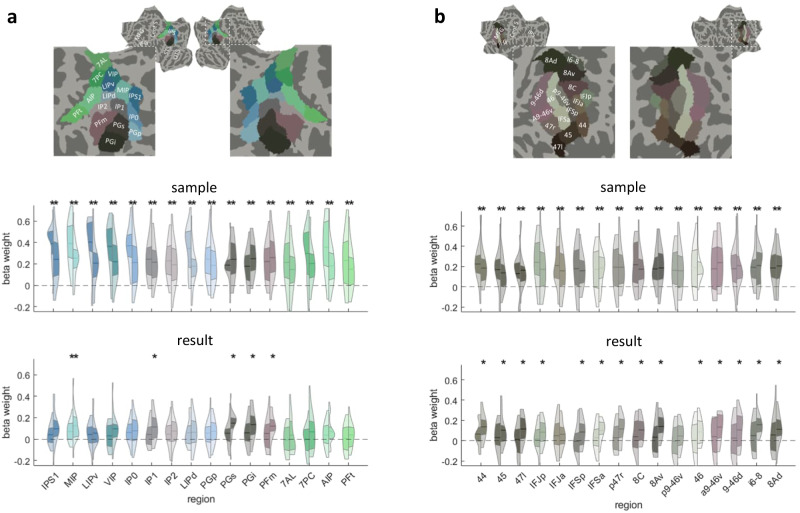
Fig. 3. Effects of sample and results numerosity in representational similarity analysis on regions of interest (ROIs).
Results for sample and results numerosity predictors in a multiple regression analysis on brain activity pattern dissimilarity are shown for subregions of the parietal (A) and lateral prefrontal (B) cortex. ROI delineation, colors, and labels are based on the Human Connectome Project (HCP-MMP1) parcellation30 shown here on the flattened cortical average surface. For each ROI, violin plots show the distribution of beta estimates for sample and result predictors (n = 17 subjects). The central horizontal line indicates the mean, and the adjacent colored area (colors corresponding to the ROIs above) the limits of the first and third quartile, with the left part of the violin for each ROI corresponding to averages of the middle (4–8 s), and the right part to averages of the late (8–12 s) delay period. Star signs (*) indicate significantly larger responses than 0 in two-tailed t-tests after false discovery rate (FDR) correction for multiple comparisons (pFDR < 0.05, across all 32 subregions and the two time periods). Source data are provided as a Source Data file.

