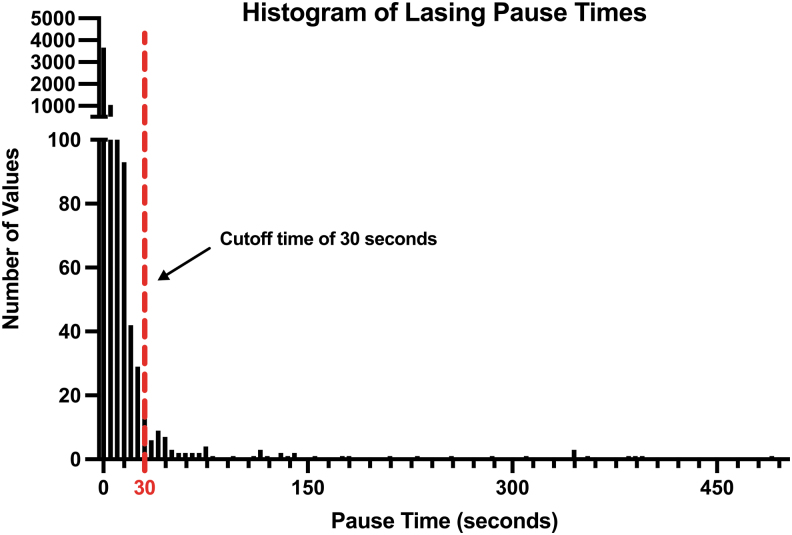
FIG. 1.
Histogram of individual count data of lasing pause times across all cases, including over 10,000 individual data points. Most pause times were recorded as 1–3 seconds; thus, the y-axis was broken at 100 to better show outlier values. Our chosen cutoff of 30 seconds is mapped above, and values greater than or equal to this value were excluded from the final analysis.

