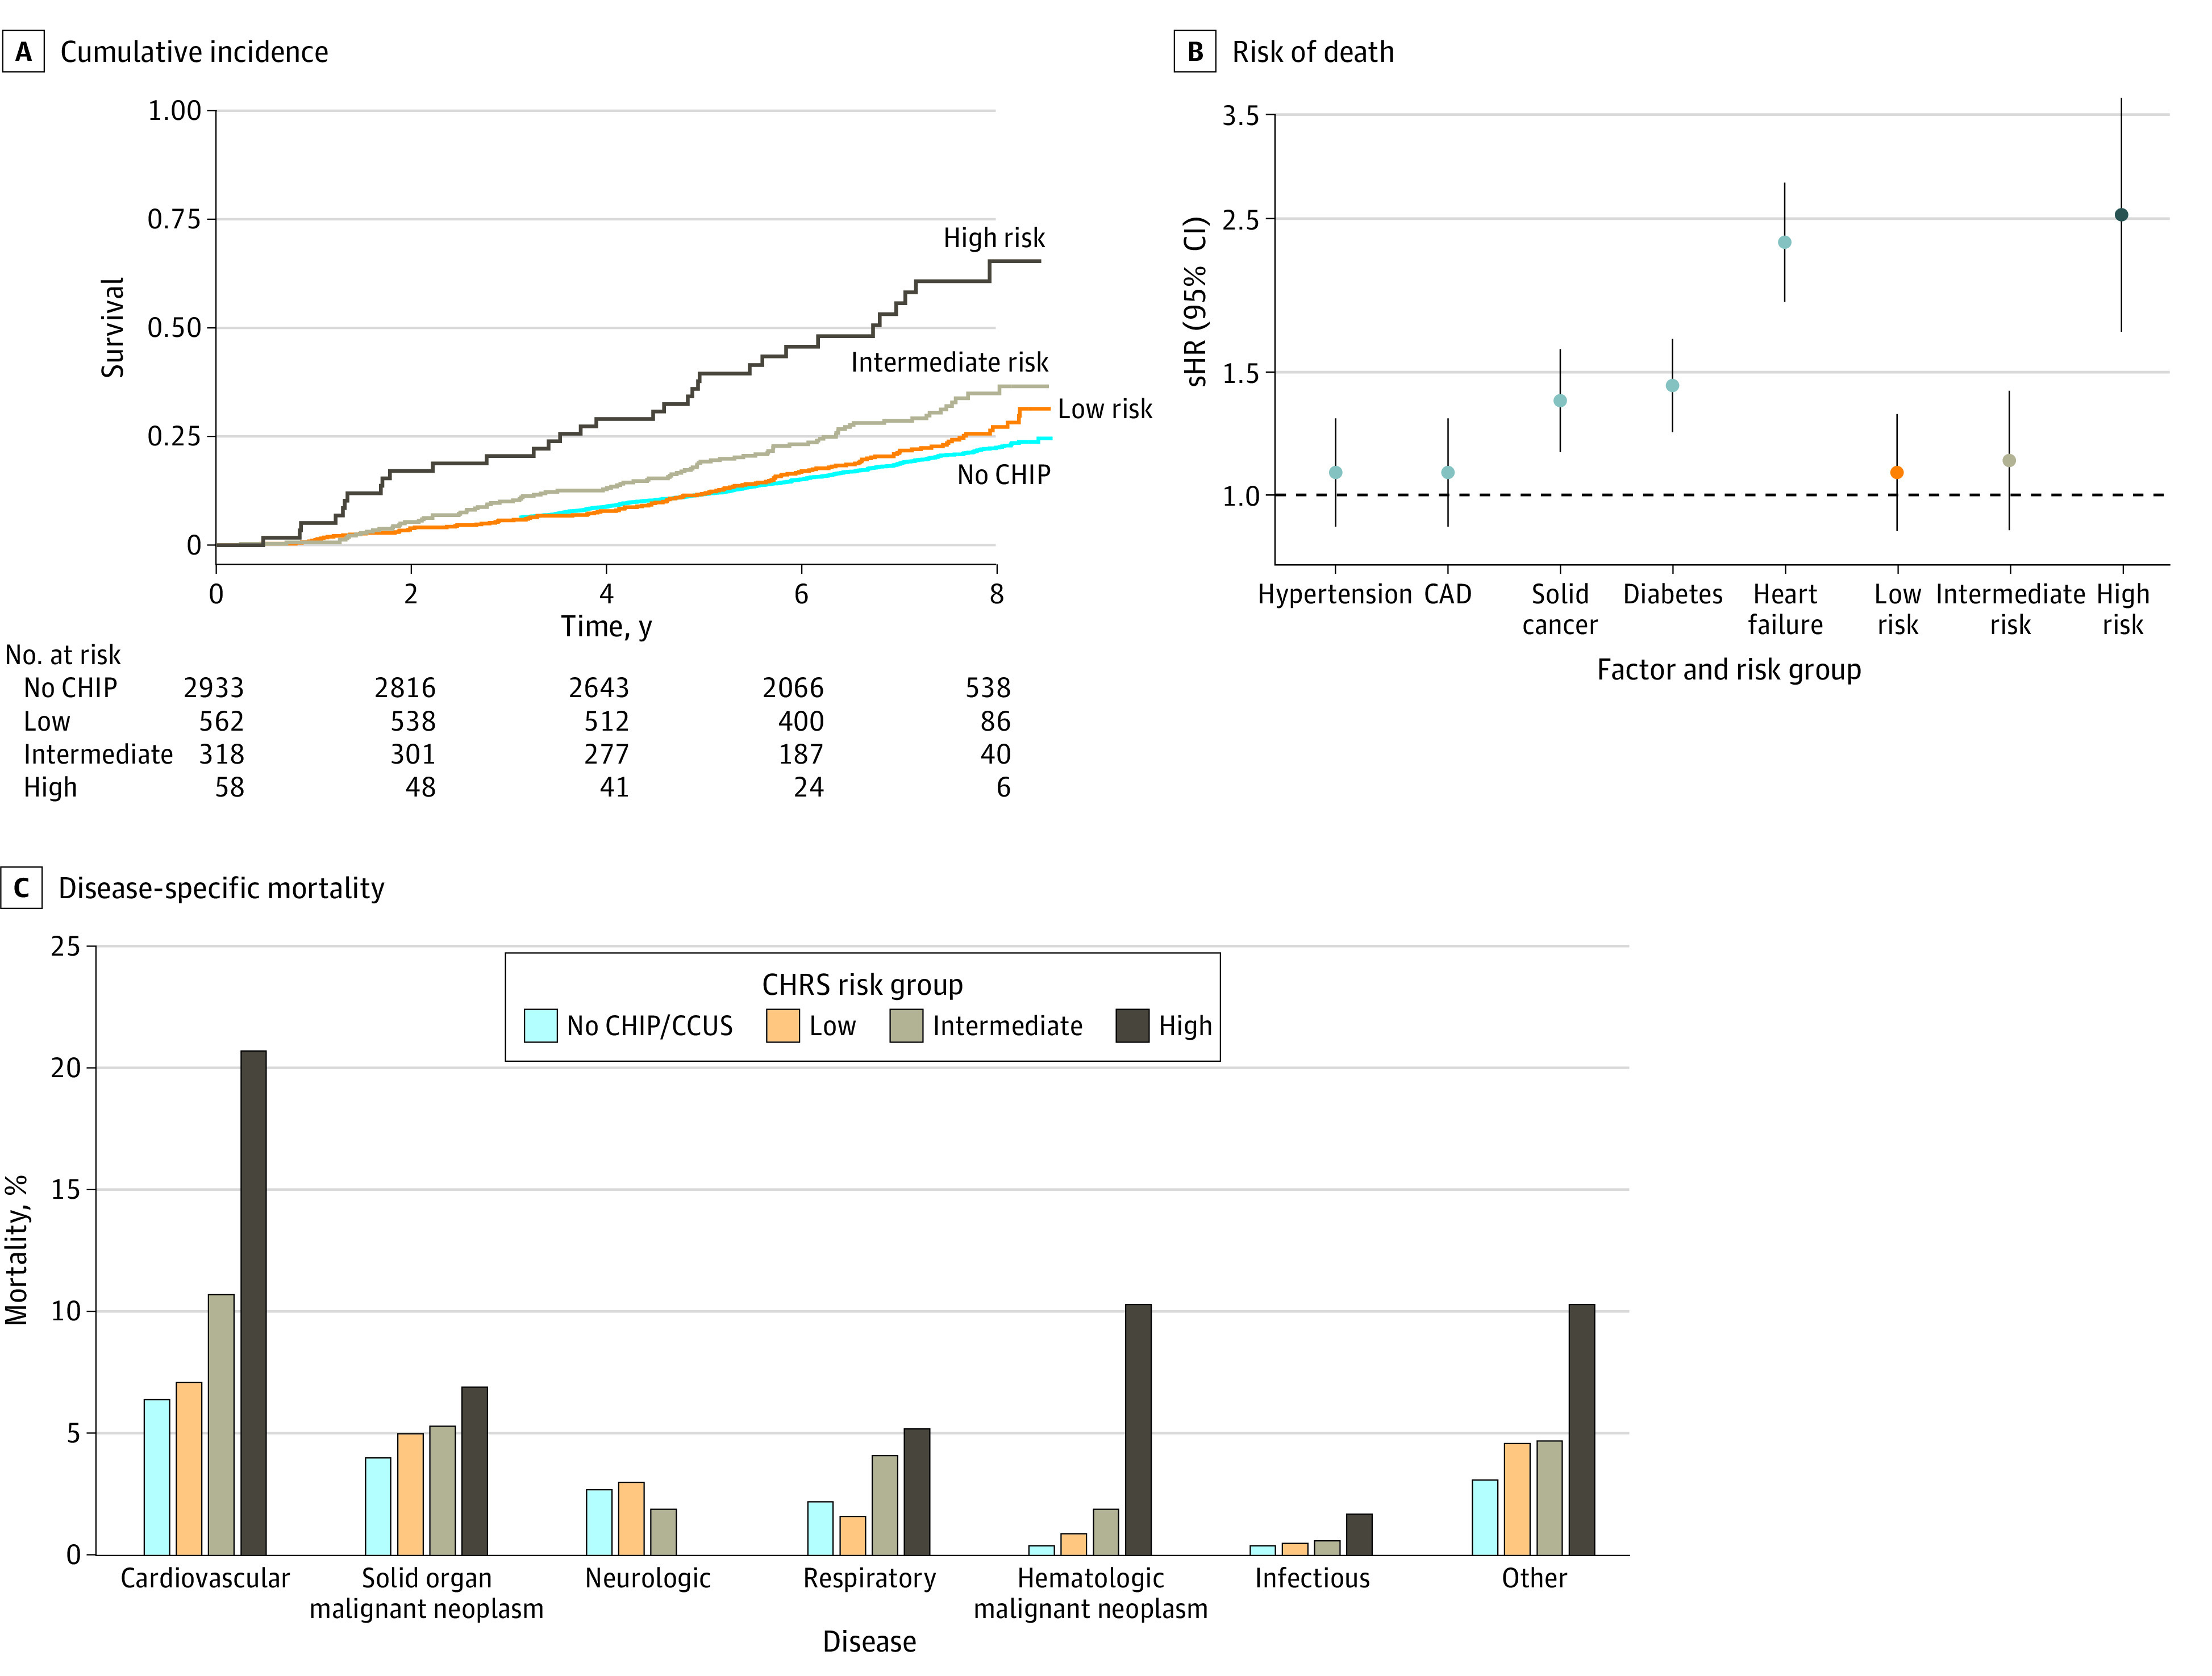
Figure. Cumulative Incidence, Associated Risk of Death, and Disease-Specific Mortality by Clonal Hematopoiesis Risk Score (CHRS) Group.

A, Graph shows cumulative incidence of death according to the CHRS risk group (ie, participants without clonal hematopoiesis [CH] of indeterminate potential [CHIP], with low-risk CH, with intermediate-risk CH, and with high-risk CH). B, Graph shows subdistribution hazard ratios (sHRs) of death associated with clinical risk factors and CHRS risk groups. sHRs were calculated by Fine-Gray competing risk regression, adjusted for age, sex, race, center, hypertension, diabetes, smoking, coronary artery disease, heart failure, and solid cancer. The clinical variable is not included as a covariate when it is the main exposure. C, Graph shows disease-specific mortality by CHRS risk group. CAD indicates coronary artery disease; and CCUS, clonal cytopenia of undetermined significance.
