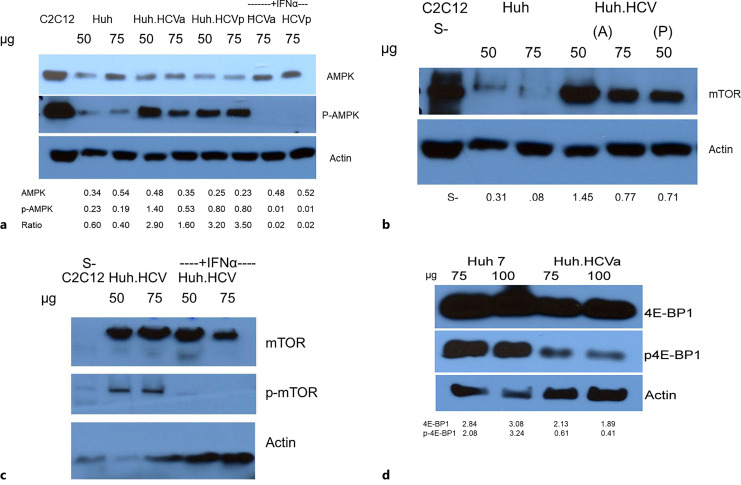
Fig. 3.
Role of AMPK, mTOR, and 4E-BP1 in cellular energy homeostasis. Western blot analysis for expression and phosphorylation of AMPK (a), mTOR (b, c), 4E-BP1 (d). Two different amounts of lysate (50 and 75 μg) from infected (Huh.HCV) and uninfected (Huh) cells were analyzed. In a, lysates from acutely and persistently infected cells were marked as Huh.HCVa and Huh.HCVp, respectively, labeled as (A) and (P) in (b), and loaded side by side for a comparison. Interferon-treated cell lysate was identified as +IFNα (a, c). A control cell lysate from serum-starved (S−) C2C12 muscle cells that show an elevated level of AMPK expression is included as control (Cell Signaling Technology, Danvers, MA). p-AMPK is phosphorylated AMPK at Thr172. The blots in (d) were probed with 4E-BP1 and p-4E-BP1 antibody. Normalized band intensity with respect to actin is indicated beneath each lane except in (a, c), where inhibition of p-AMPK and p-mTOR by IFNα was demonstrated. The lower intensity of the bands in the first control lane may result from a technical problem of protein transfer and processing of the blot.

