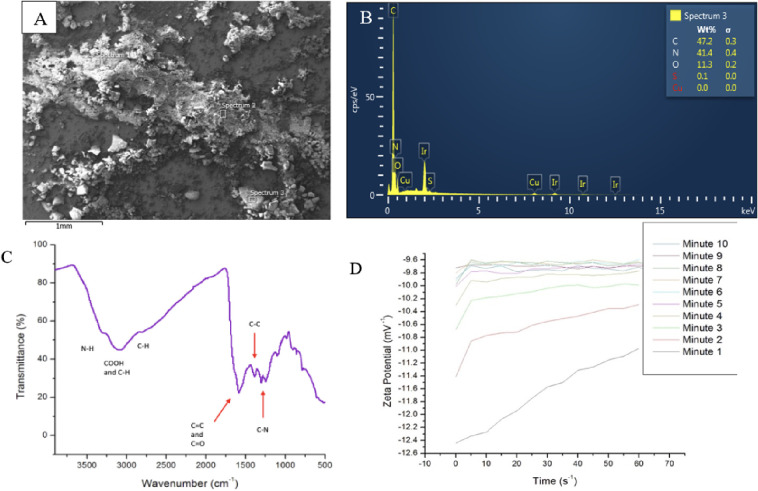
Figure 3.
(A) SEM electron image of bulk transferrin-derived nanoparticles. (B) EDS spectrum of a spot location of the transferrin-derived nanomaterial. The majority of the sample is made of carbon, then nitrogen, and then oxygen with trace amounts of sulfur. The sample was sputter coated with iridium to reduce surface charging. (C) ATR-FTIR spectrum of CD71 affinity CDs. Strong peaks at 1600–1585 cm–1 and 1680–1640 cm–1 indicate a graphene CD core. Additional peaks indicate amino acid functional groups present in the nanoparticles. (D) Zeta potentials of 39 μM transferrin carbon dots in DI water. After about 5 min, the zeta potential of the nanoparticles stabilized to indicate a zeta potential of −9.7 mV–1.

