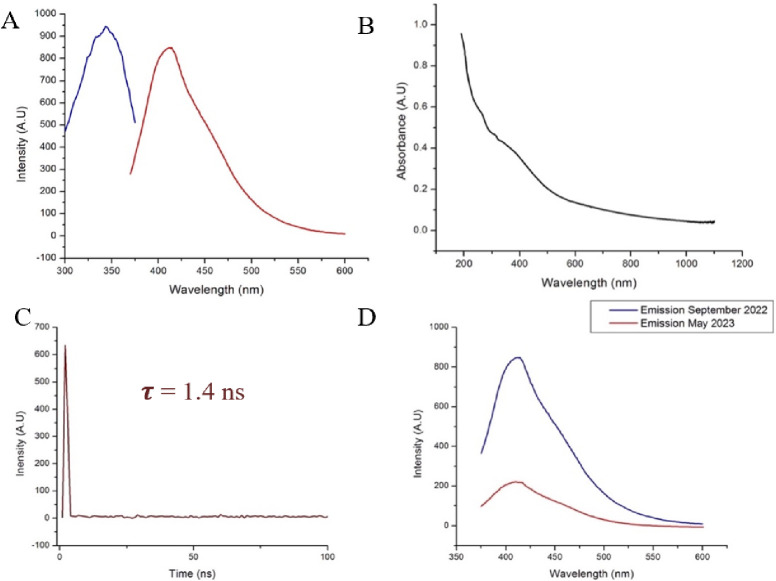
Figure 4.
(A) Fluorescence excitation (blue) and emission (red) spectra of 0.39 μM transferrin-derived affinity carbon dots in DI water. The peak excitation wavelength is 343 nm. At that excitation wavelength, the resulting peak emission wavelength is 413 nm. (B) The UV–visible spectrum was 0.39 μM. A slight peak is seen in the curve at from 300 to 400 nm. This is in the same region as the nanoparticles have peak absorption, as can be seen in the fluorescence emission spectrum. (C) Lifetime fluorescence emission decay of affinity CDs using time-correlated single photon spectroscopy. Equation 2 was used to calculate the lifetime decay and found to be 1.4 ns. (D) Fluorescence emission profile of transferrin nanoparticles. Maximum emission was observed at 413 nm under 343 nm excitation.

