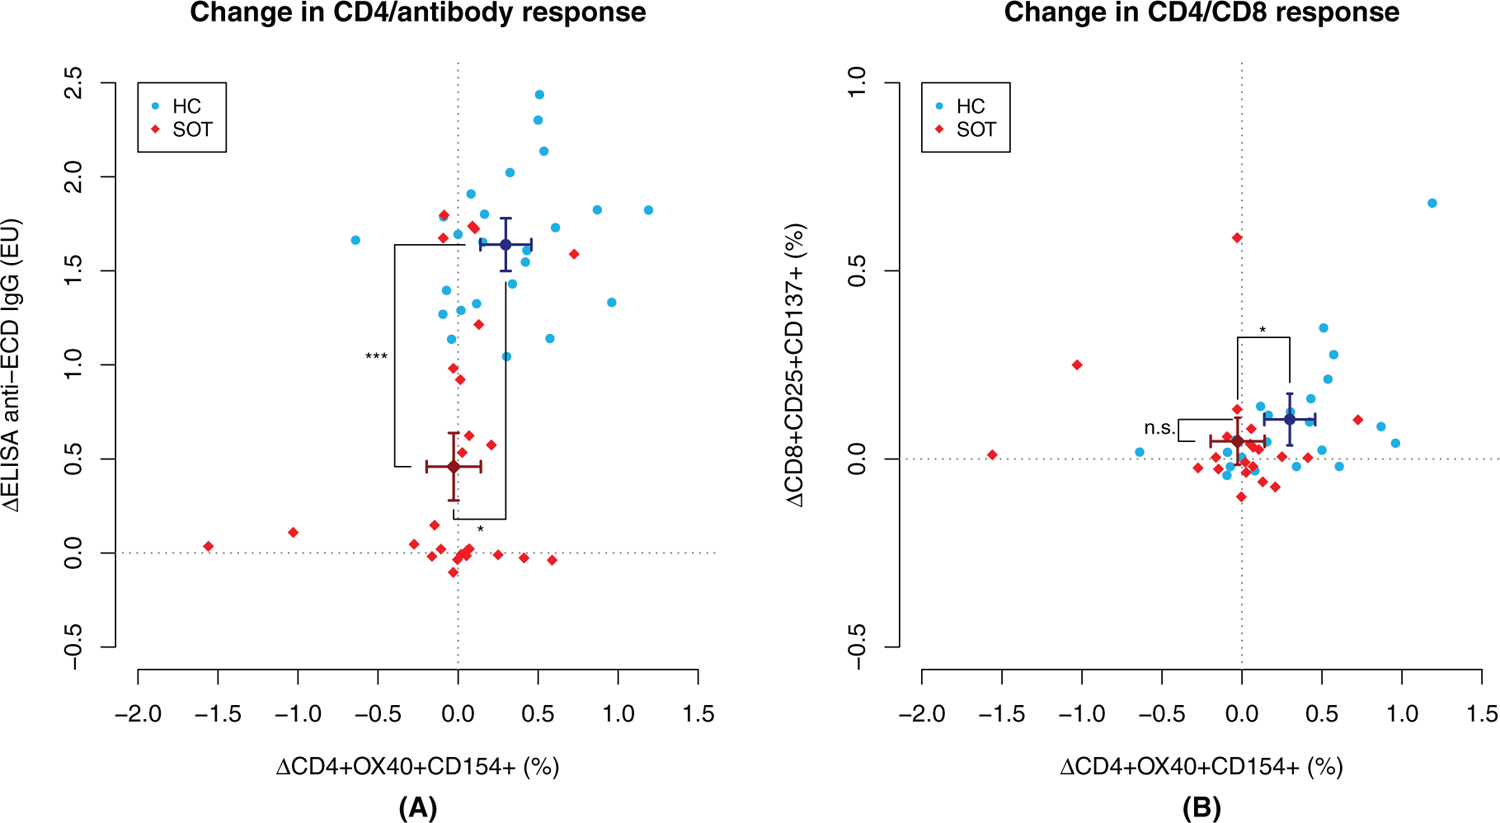
FIGURE 2.

Changes in cellular and humoral immune responses to severe acute respiratory syndrome coronavirus 2 (SARS-CoV-2) extracellular domain (ECD) between baseline and visit 3 in healthy controls (HCs) and solid organ transplant (SOT) recipients. In panel (A), we present the change in %CD4+ T cells responsive to extracellular domain (ECD) on the x-axis and change in IgG response to ECD on the y-axis. In panel (B), the y-axis represents change in %CD8+ T cells responsive to peptides. Also depicted in each plot are the point estimates and respective 95% CIs for each assay
