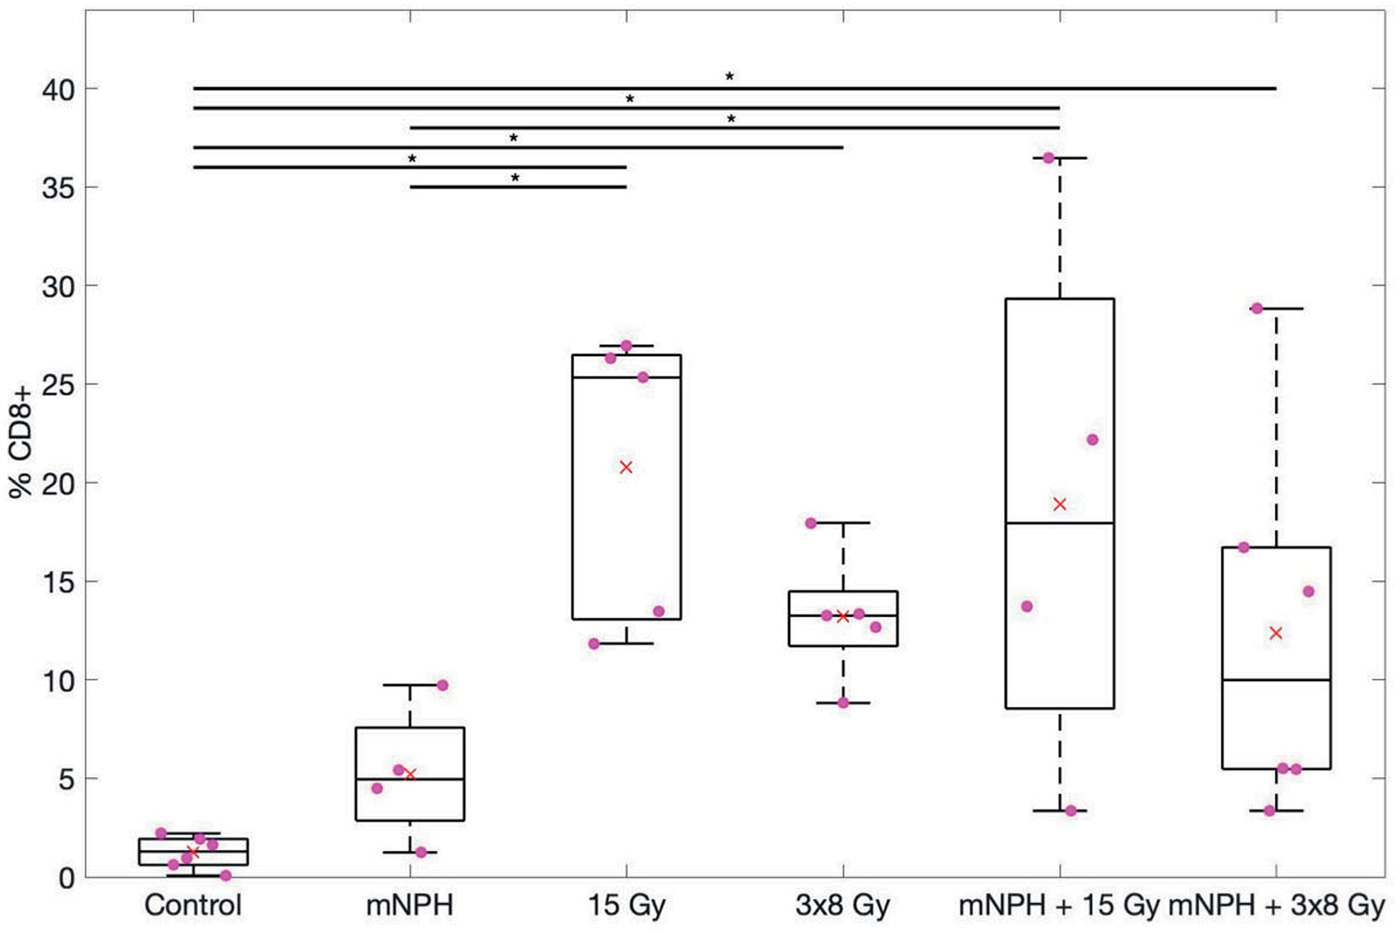
Figure 2.

This box and whisker graph illustrates the CD8 population percentages for each treatment. The combinatorial treatments have a greater spread than the radiation alone groups, and 15 Gy alone and in combination leads to greater CD8 populations within the tumor. The red × demonstrates the mean, and the * means *p<.05.
