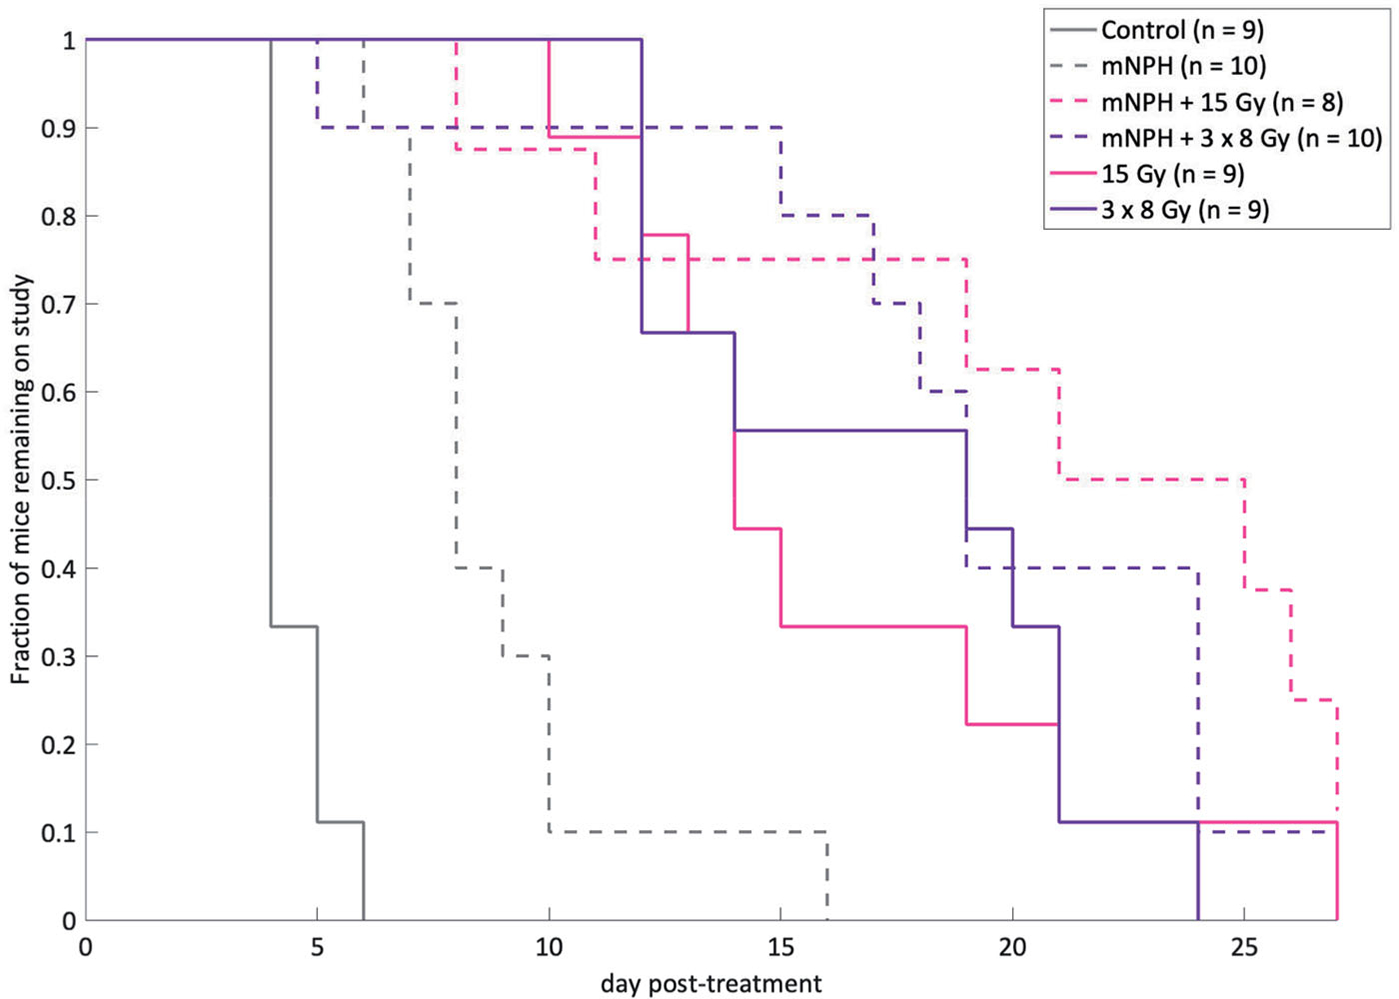
Figure 3.

This graph demonstrates post-treatment tumor response, for the following groups: control, mNPH, 15 Gy, 3×8Gy, 15 Gy + mNPH, and 3×8 Gy + mNPH. All treatments resulted in statistically significant improvements as compared to control. The mNPH treatment, which is generally considered minimally cytotoxic was expectedly less effective than either radiation dose or the combination.
