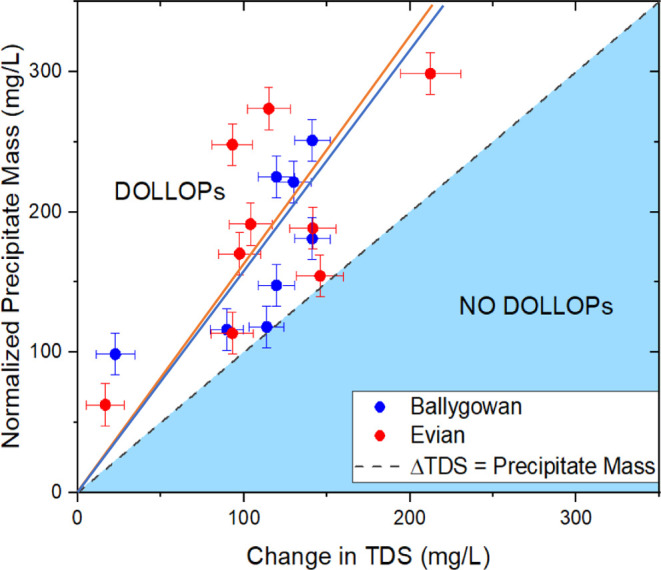
Figure 7.

Plot of the change in total dissolved solids against the precipitate mass shows that the latter is consistently greater. Points in the white region indicate the presence of calcium carbonate in the water in the form of DOLLOPs that does not contribute to the conductivity. The slopes of the lines are 1.57 ± 0.10 for Evian and 1.53 ± 0.12 for Ballygowan.
