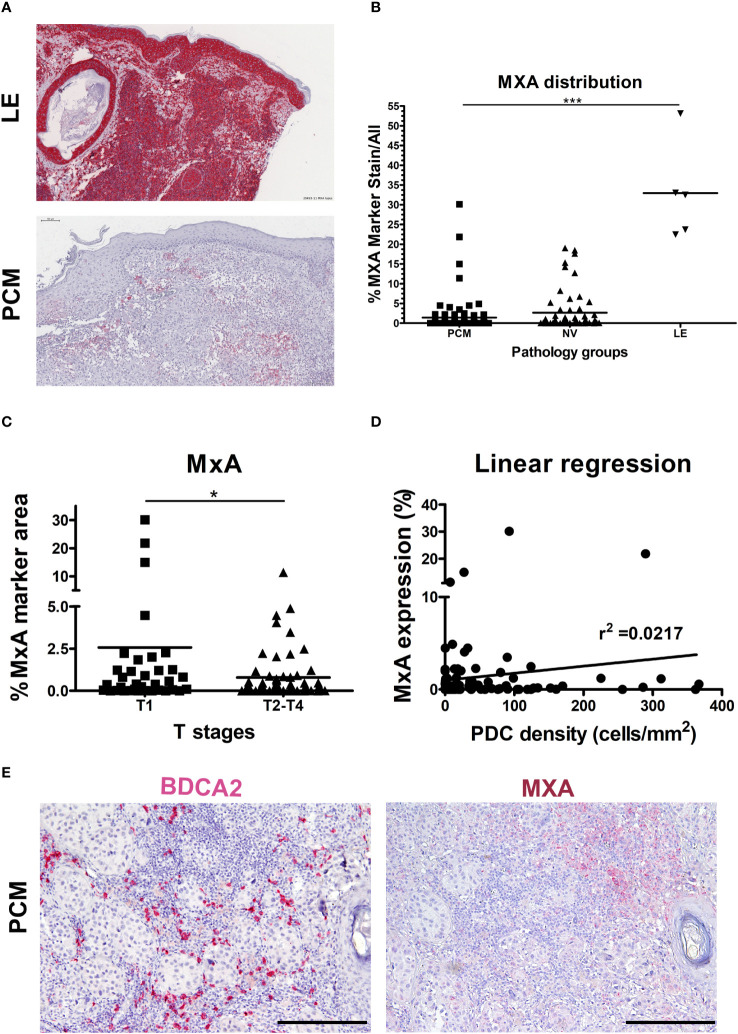
Figure 2.
Limited MxA expression in human PCM. (A) Representative sections of lupus erythematosus (LE; upper panel) and primary cutaneous melanoma (PCM; lower panel) biopsies showing high and low levels of MxA expression, respectively. Sections are stained as label and counterstained with Haematoxylin. Magnification 100X. Scale bar 100 µm. (B) Dot plots show the percentages of MxA positive signal on evaluated area in PCM, benign nevi (NV) and LE biopsies. Bars represent the mean of biological replicates. The statistical significance was calculated by One-way ANOVA (p< 0.0001) and Bonferroni multiple comparison; ***p < 0.001. (C) Dot plots show the percentage of MxA+ marker area, obtained by digital microscopy analysis, in T1 versus T2-T4 stages of PCM. Bars represent the mean of biological replicates. The statistical significance was calculated by unpaired Student’s T test (p= 0.0411); *p < 0.05. (D) Linear regression analysis between MxA expression and BDCA2+ pDCs density in PCM. (E) Representative images of BDCA2 (left panel) and MxA (right panel) staining in a PCM case. Magnification 100X. Scale bar 200 µm.

