Figure 3.
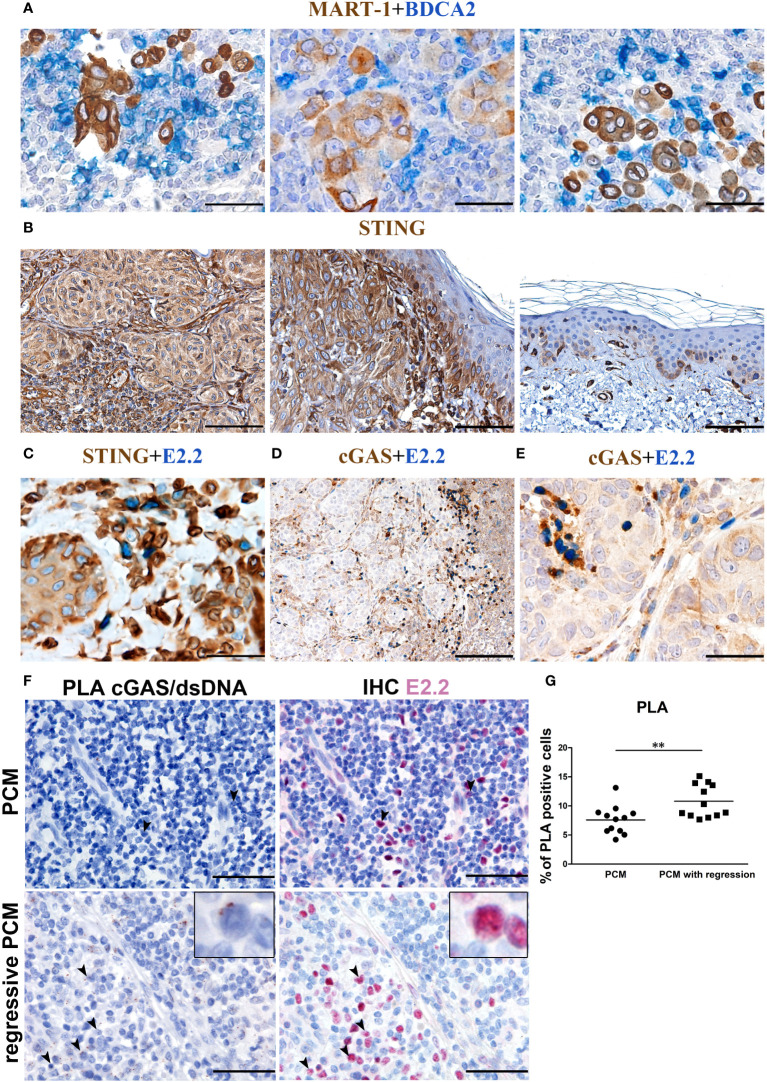
cGAS expression and endogenous activation in PCM-infiltrating pDCs. Representative PCM cases showing (A) the interaction between BDCA2+ pDCs and Mart-1+ melanoma cells, (B) STING reactivity that results positive on PCM case and negative on adjacent normal skin (C) STING reactivity on E2.2+ pDCs and (D, E) cGAS reactivity on E2.2+ pDCs. Magnification 400X. Scale bar 50 µm (A, C, E). Magnification 100X, scale bar 200µm (B, D). (F) Representative microphotographs showing dsDNA-cGAS interactions detected by PLA (brown; left panels) combined with anti-E2.2 IHC staining (red; right panels) in PCM cases (upper panels) and PCM cases with regression (lower panels). Increased signals elements that co-express the dsDNA-cGAS interactions and E2.2 signals is observed in PCM cases with regression, identified as activated pDCs pointed by black arrowheads (zoomed in on the insert). Scale bar 50µm. (G) Scatter dot plots show the percentage of PLA positive cells evaluated in twelve non-overlapping fields at high-power magnification (400X) of PCM and PCM with regression cases. Bars represent the mean of biological replicates. The statistical significance was calculated by unpaired Student’s T test (p= 0.0068); ** p < 0.01.

