Figure 5.
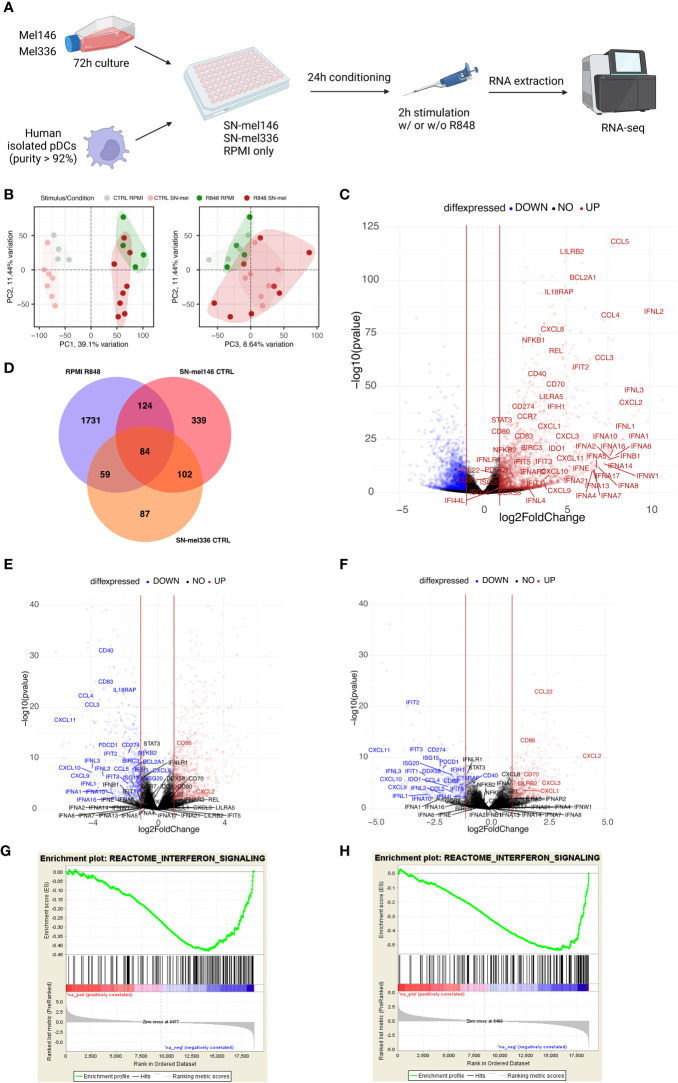
SN-mel modulates the pDC transcriptomic profile toward an immune suppressive state. (A) Graphical abstract depicts the experimental settings. Created with BioRender.com. (B) Scatter plots showing the combined projections of the first three components of a principal component analysis (PCA) run considering the whole gene expression on the SN-mel-exposed or RPMI-cultured pDCs samples resting and R848 stimulated. Samples’ features are highlighted by colour code. (C) Volcano plots showing the log2 Fold Change and -log10 p-value of differential expression among RPMI-R848 stimulated vs RPMI-CTRL unstimulated pDCs. (D) Venn diagram shows the number of upregulated genes in R848 stimulated pDCs versus unstimulated pDCs (purple) and the number of downregulated genes in unstimulated pDCs exposed to SN-mel 146 (red) and SN-mel 336 (orange) as compared to unstimulated pDCs in RPMI condition. (E, F) Volcano plots showing the log2 Fold Change and -log10 p-value of differential expression among SN-mel146-CTRL vs RPMI-CTRL (E) and SN-mel336-CTRL vs RPMI-CTRL (F) pDCs. Vertical red lines highlight a |Log2FoldChange| = 1. (G, H) Enrichment plots for the set of the interferon signaling in the transcriptome of SN-mel146 (G) and SN-mel336 (H) exposed pDCs versus RPMI cultured pDCs by GSEA.

