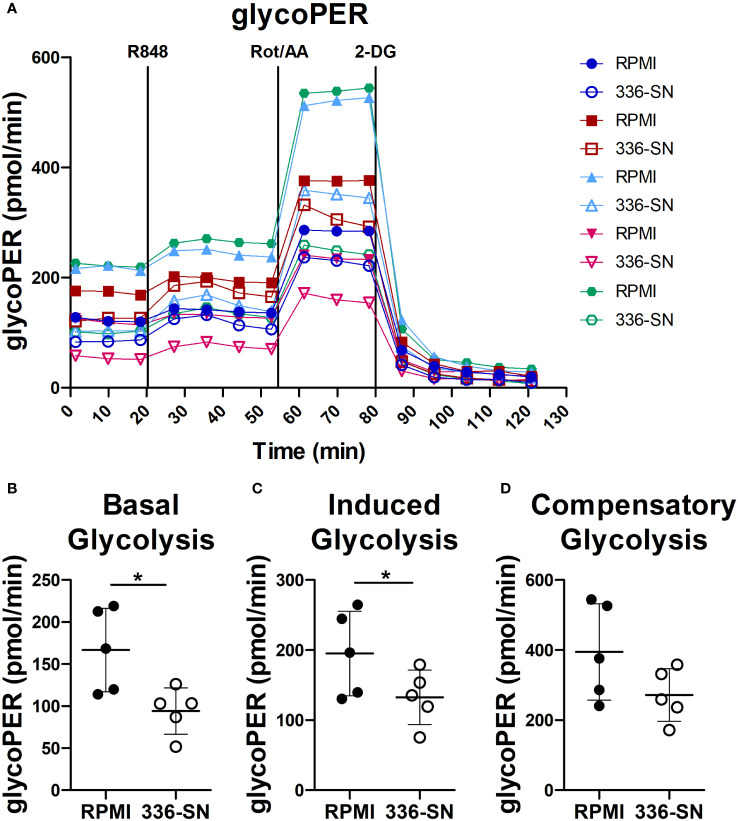
Figure 7.
SN-mel exposure reduced glycolysis in pDCs. pDCs were cultured in RPMI medium or SN-mel 336 with no stimuli for 24h. pDCs were then subjected to the Glycolytic Rate Assay and glycolytic real-time proton efflux rate (glycoPER) is derived over the indicated time points (A). Vertical lines indicate addition of R848, rotenone plus antimycin A (Rot/AA) and 2-deoxy-D-glucose (2-DG). Colors represent different healthy donors and dots represent the mean value of technical replicates. Basal glycolysis corresponds to the glycoPER value obtained at the time point before R848 injection (B); p = 0.013). Induced glycolysis is calculated on the average glycoPER values over the four time points after R848 treatment (C); p = 0.042). Compensatory glycolysis corresponds to glycoPER value measured at the third time point after Rot/AA injection (D); p = 0.056). Bars represent the mean ± SD of biological replicates (n = 5). The statistical significance was calculated by two-tailed Paired Student’s t-test; * p < 0.05.

